![[FREE EBOOK] Strategic Vietnam IT Outsourcing: Optimizing Cost and Workforce Efficiency](https://vti.com.vn/wp-content/uploads/2023/08/cover-mockup_ebook-it-outsourcing-20230331111004-ynxdn-1.png)


Across APAC manufacturing operations, the pressure to reduce environmental impact is no longer arriving from a single direction. Energy costs are rising steadily across the region, global customers enforcing ESG supplier requirements, environmental regulations tightening, and sustainable supply chain audits becoming standard practice. Green production addresses this convergence by embedding resource efficiency and environmental accountability directly into operational strategy.
More importantly, green production transforms environmental compliance from a cost center into a competitive advantage – one that reduces operational expenses while securing the supplier relationships that will define APAC manufacturing participation over the next decade.
What Is Green Production?
Definition of Green Production
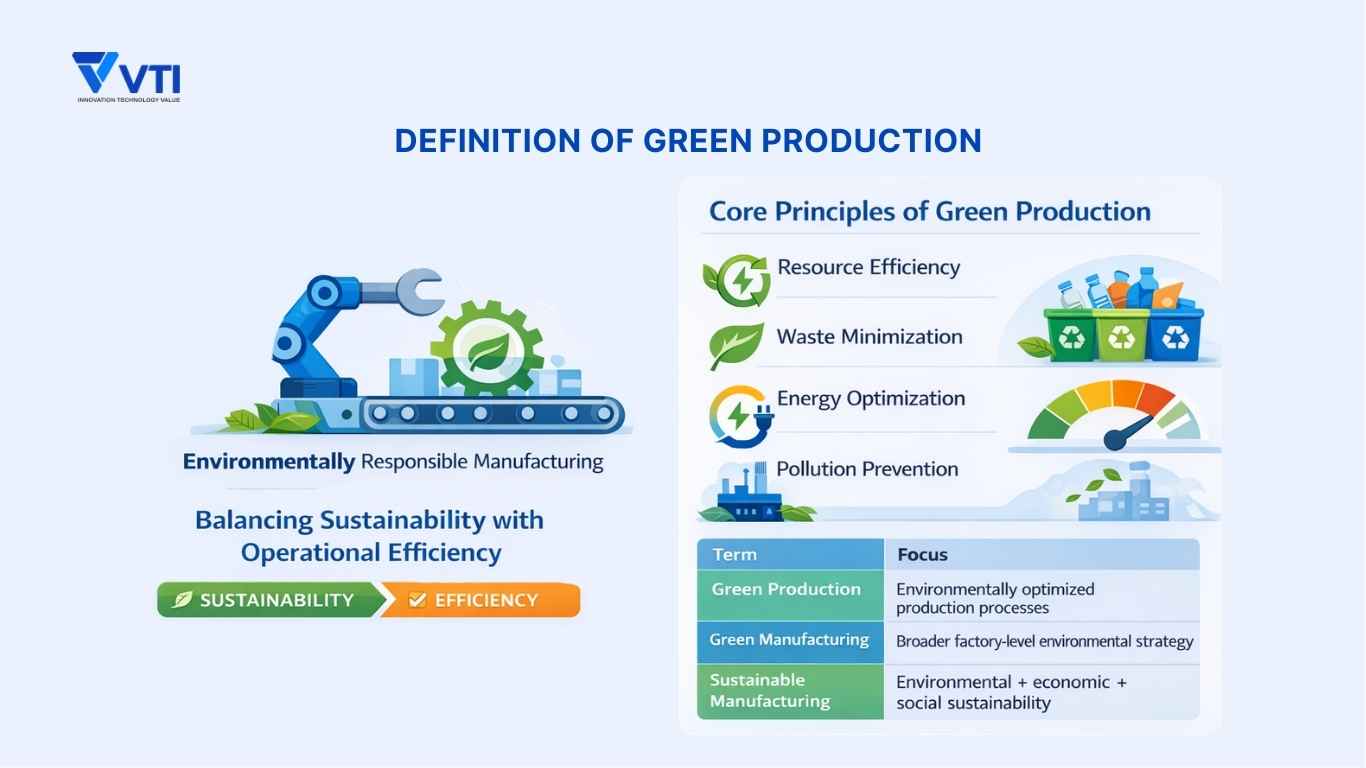
Green production refers to the application of environmentally responsible practices across manufacturing processes – from raw material consumption and energy use through to waste output and emissions. The core objective is to minimize the environmental impact of production operations without compromising throughput, product quality, or cost competitiveness.
In practice, green production is not a standalone initiative. Instead, it functions as an operational discipline embedded in how factories plan, execute, and monitor production daily. For APAC manufacturers facing rising input costs and increasing scrutiny from global customers, it offers a structured approach to running a more efficient, resilient, and audit-ready operation.
Core Principles of Green Production
Green production is built on five interconnected principles that, when applied together, drive both environmental and operational improvement:
- Resource efficiency: maximizing the output extracted from each unit of raw material, water, and energy consumed in the production process.
- Waste minimization: reducing scrap, rework, overproduction, and process losses at the source, rather than managing waste after it has already been generated. In addition, this aligns closely with lean manufacturing principles and forms the foundation of any green production program.
- Energy optimization: identifying and eliminating energy losses across production equipment, HVAC systems, compressed air networks, and facility infrastructure. In high-energy-intensity sectors such as metal processing, plastics, and electronics assembly, energy optimization typically delivers the fastest measurable ROI.
- Pollution prevention: controlling emissions, effluents, and hazardous outputs through process design and real-time monitoring, rather than end-of-pipe treatment alone.
- Life cycle thinking: evaluating environmental impact across the full product life cycle, from material sourcing through production, distribution, use, and end-of-life disposal. Furthermore, this principle is increasingly relevant as OEM customers require Scope 3 emissions data from their supplier base.
Green Production vs. Green Manufacturing vs. Sustainable Manufacturing
These three terms are frequently used interchangeably, but they describe distinct scopes of action. Understanding the distinction matters when defining the boundaries of a factory-level program and aligning it with corporate ESG reporting requirements.
| Term | Focus |
| Green production | Environmentally optimized production processes |
| Green manufacturing | Broader factory-level environmental strategy |
| Sustainable manufacturing | Environmental + economic + social sustainability |
Green production is the most operationally specific of the three — it addresses what happens inside production processes:
- How materials are consumed
- How energy is used
- How waste is generated and controlled
Green manufacturing expands the scope to the facility level, encompassing infrastructure, supplier selection, and environmental management systems such as ISO 14001. Sustainable manufacturing is the broadest framework, incorporating social dimensions — labor practices, community impact, and long-term economic viability — alongside environmental performance.
For factory directors and plant managers in APAC, green production is typically the most actionable entry point. It delivers measurable results within existing operational boundaries, generates the data needed to support broader green manufacturing and sustainability programs, and directly addresses the production-level metrics that global customers and regulatory bodies are increasingly requiring.
Why Green Production Is Becoming Critical for APAC Manufacturers
Rising Energy Costs in Industrial Production
As global energy markets face unprecedented volatility, the “energy-intensive” nature of traditional manufacturing has become a significant financial liability.
- In many electricity-intensive operations (e.g., injection molding, metal fabrication, electronics assembly, surface treatment), energy represents a significant portion of total production costs. Therefore, even modest efficiency gains can directly improve margins.
- Moreover, rising industrial electricity tariffs across the region mean energy is no longer a fixed overhead. Instead, it acts as a variable cost that directly impacts profitability.
Green production addresses this through structured energy optimization: real-time consumption monitoring at the machine and line level, identification of idle-state losses, and data-driven targeting of the highest-impact reduction opportunities across the production floor.
ESG and Carbon Reduction Requirements from Global Supply Chains
Global OEMs and multinational corporations (MNCs) and OEMs are aggressively de-carbonizing their entire value chains, placing APAC suppliers under the microscope.
- International OEM Requirements: Leading OEMs (such as Apple, Samsung,…) now mandate that their Tier 1 and Tier 2 suppliers provide transparent roadmaps for carbon neutrality.
- Scope 1 and Scope 2 Emissions Tracking: To remain in the supply chain, manufacturers must accurately monitor and report Scope 1 (direct emissions from owned sources) and Scope 2 (indirect emissions from purchased electricity). Without digital traceability, proving compliance becomes nearly impossible.
- Sustainability Audits: Regular audits are now standard procedure. This is especially critical for Japanese and Korean FDI (Foreign Direct Investment) projects in Southeast Asia, where parent companies must align their overseas production with strict domestic ESG standards.
Environmental Regulations Across APAC
The regulatory environment for industrial environmental performance is tightening across the region, and the trajectory is consistent: stricter standards, more rigorous enforcement, and mandatory reporting requirements expanding to cover more sectors and facility sizes.
- Thailand: Policies such as the Alternative Energy Development Plan (AEDP) and increased incentives for renewable energy adoption are pushing industrial zones to reduce carbon intensity, improve energy efficiency, and integrate circular economy practices into manufacturing operations.
- Japan: With a firm 2050 Carbon Neutrality target, Japan is implementing strict energy conservation laws and promoting “Green Transformation” (GX) initiatives across its industrial sectors.
- South Korea: The Green New Deal focuses on transforming high-carbon industries into low-carbon, smart manufacturing hubs through heavy investment in hydrogen and green tech.
For factory leadership, the practical implication is straightforward: regulatory compliance is a floor, not a ceiling. Factories that build green production capability now are better positioned to absorb future regulatory changes without operational disruption or capital-intensive catch-up investment.
Competitive Pressure Toward Sustainable Manufacturing
Environmental performance is becoming a commercial variable — one that affects supplier selection decisions, export market access, and the terms on which manufacturers can attract investment.
Supplier selection — global procurement teams are incorporating environmental scorecards into vendor evaluation processes. Factories with documented energy reduction programs, verified emissions data, and ISO 14001-aligned environmental management systems are scoring higher in competitive tenders. Those without are increasingly being asked to remediate before qualification can proceed.
Export competitiveness — the European Union’s Carbon Border Adjustment Mechanism (CBAM) is creating direct cost implications for APAC manufacturers exporting carbon-intensive products into EU markets. As similar frameworks emerge in other jurisdictions, the carbon intensity of production will affect the effective price competitiveness of exported goods — making green production a trade competitiveness issue, not just an environmental one.
Investor expectations — ESG performance is now a factor in financing decisions for manufacturing facilities. Banks, private equity investors, and development finance institutions increasingly apply environmental criteria to lending and investment assessments. Factories that can demonstrate structured green production programs and credible emissions trajectories are accessing more favorable financing terms — while those that cannot are facing higher risk premiums or exclusion from certain funding pools.
Taken together, these pressures are restructuring the competitive landscape for APAC manufacturers. Green production is no longer a cost — it is a positioning decision with direct implications for market access, customer retention, and long-term operational viability.
The Core Pillars of Green Production in a Factory
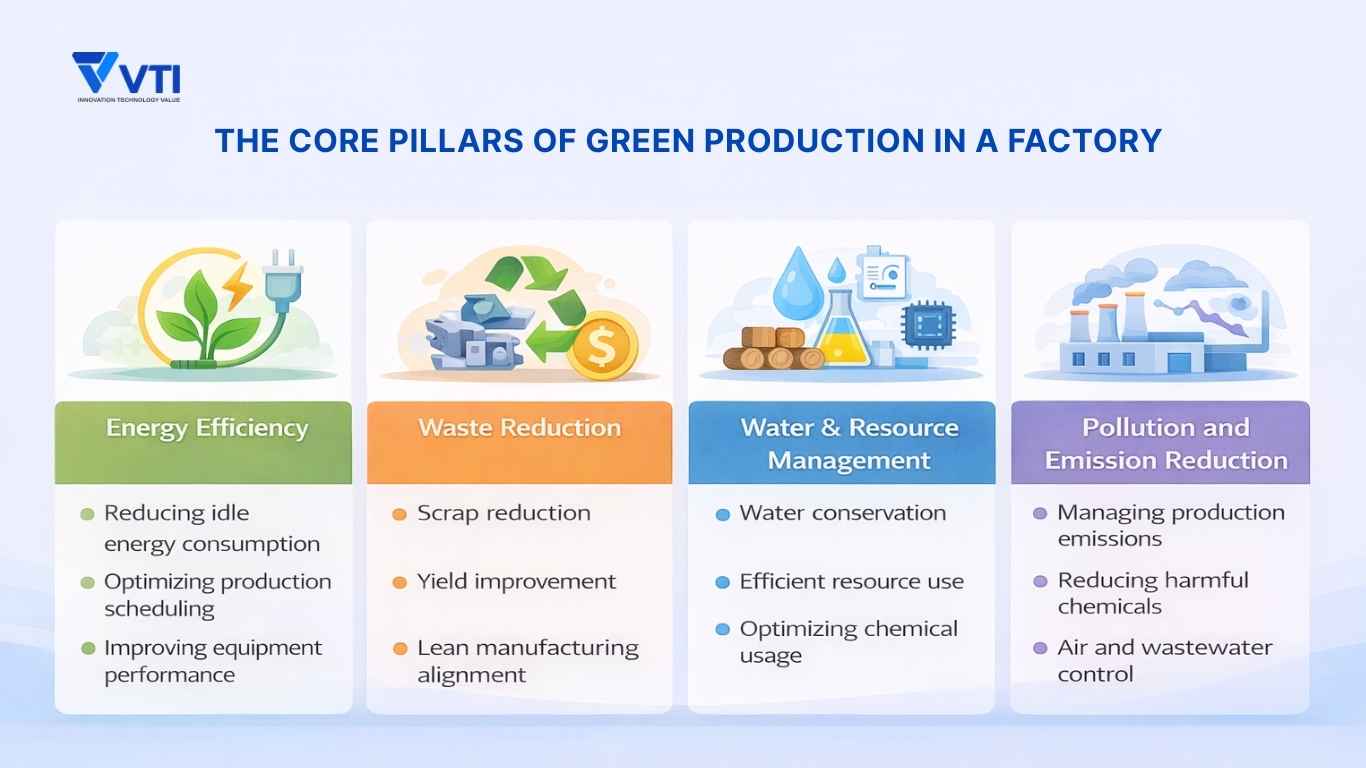
Energy Efficiency in Manufacturing Processes
Energy efficiency is the cumulative result of eliminating losses across every stage of manufacturing.
- Reduce machine idle energy: A significant share of total energy is consumed when equipment runs but does not produce: during changeovers, breaks, material waiting, and unplanned stoppages. Monitoring idle consumption and automating shutdown for non-critical equipment recovers energy without capital investment.
- Optimize scheduling for energy: Consolidate runs to reduce warm-up cycles, sequence energy-intensive operations to avoid peak demand, and align production with off-peak tariff periods.
- Track machine-level performance: Without granular consumption data by asset and shift, identifying underperforming equipment is guesswork. Energy metering and energy-based OEE metrics enable continuous improvement.
Waste Reduction and Material Optimization
In green production, waste is a direct measure of production efficiency. Every unit of scrap represents lost material, energy, and cost.
- Reduce scrap through visibility: High scrap is often caused by process drift, tooling wear, or setup inconsistency, not operator error. Track scrap by machine, shift, and defect type to enable targeted improvement.
- Improve first-pass yield: Even a 1–2 percent yield improvement in material-intensive sectors significantly reduces both cost and environmental impact.
- Align with lean principles: Eliminating muda (overproduction, defects, excess processing) directly supports green objectives while improving flow and cost.
Water and Resource Management
Water is a critical input increasingly subject to regulatory limits and usage fees.
- Monitor consumption: Meter usage by process and area. Set reduction targets against production-normalized benchmarks, not absolute volume.
- Optimize processes: Review rinse cycles, cooling circuits, and cleaning sequences to reduce draw without compromising outcomes.
- Recover and recirculate: Where feasible, recapturing process water reduces both intake and effluent treatment load.
- Manage compressed air: Leakage alone can account for 20–30 percent of compressor energy in plants without active detection programs.
Pollution and Emission Reduction
Prevention at source is more effective than end-of-pipe treatment.
- Control process emissions: VOCs, particulate matter, and thermal emissions are manageable through parameter control, equipment specification, and real-time monitoring. Establish baselines by process for reporting and reduction targeting.
- Substitute harmful chemicals: Systematically review material inputs. Replacing high-hazard substances reduces regulatory exposure and waste handling cost.
- Close the loop with monitoring: Air and wastewater controls must perform under varying production loads. Real-time monitoring integrated with production systems — not periodic sampling — is the expected baseline.
Common Barriers to Implementing Green Production in Factories
Lack of Visibility into Energy and Resource Consumption
Most factories across APAC cannot answer two fundamental questions: which machines consume the most energy, and where is waste actually being generated?
Without sub-metered monitoring at equipment level, total facility consumption is visible but not actionable. Factory managers do not know which production line, shift pattern, or product mix is driving it. The same gap applies to material consumption: aggregate figures are tracked, but the process-level detail needed for reduction opportunities is missing.
Fragmented Production Data
Even where data exists, it is often trapped in isolated systems that don’t communicate. Energy readings sit in building management systems, production volume in the ERP, and scrap rates in manual spreadsheets.
Correlating energy use with production output currently requires manual, error-prone data assembly. By the time the analysis is ready, the production conditions have already changed. Modern solutions solve this by connecting SCADA, MES, and IoT sensors into a single source of truth. This allows for real-time correlation between energy intensity, quality, and asset performance, turning siloed numbers into strategic intelligence.
Concerns About Impact on Productivity
A persistent misconception among plant managers is that “Green” equals “Slow” — that reducing energy or material usage will inevitably constrain throughput. In reality, green production objectives are perfectly aligned with Overall Equipment Effectiveness (OEE):
- Reducing idle cycles wastes less energy and produces more per hour.
- Lowering scrap rates saves material and delivers higher yields.
Productivity losses only occur when green targets are set without reference to production constraints. When implemented correctly through data-driven optimization, green production is not a trade-off, it is a high-performance productivity program that happens to have a positive environmental impact.
Technologies Enabling Green Production in Smart Factories
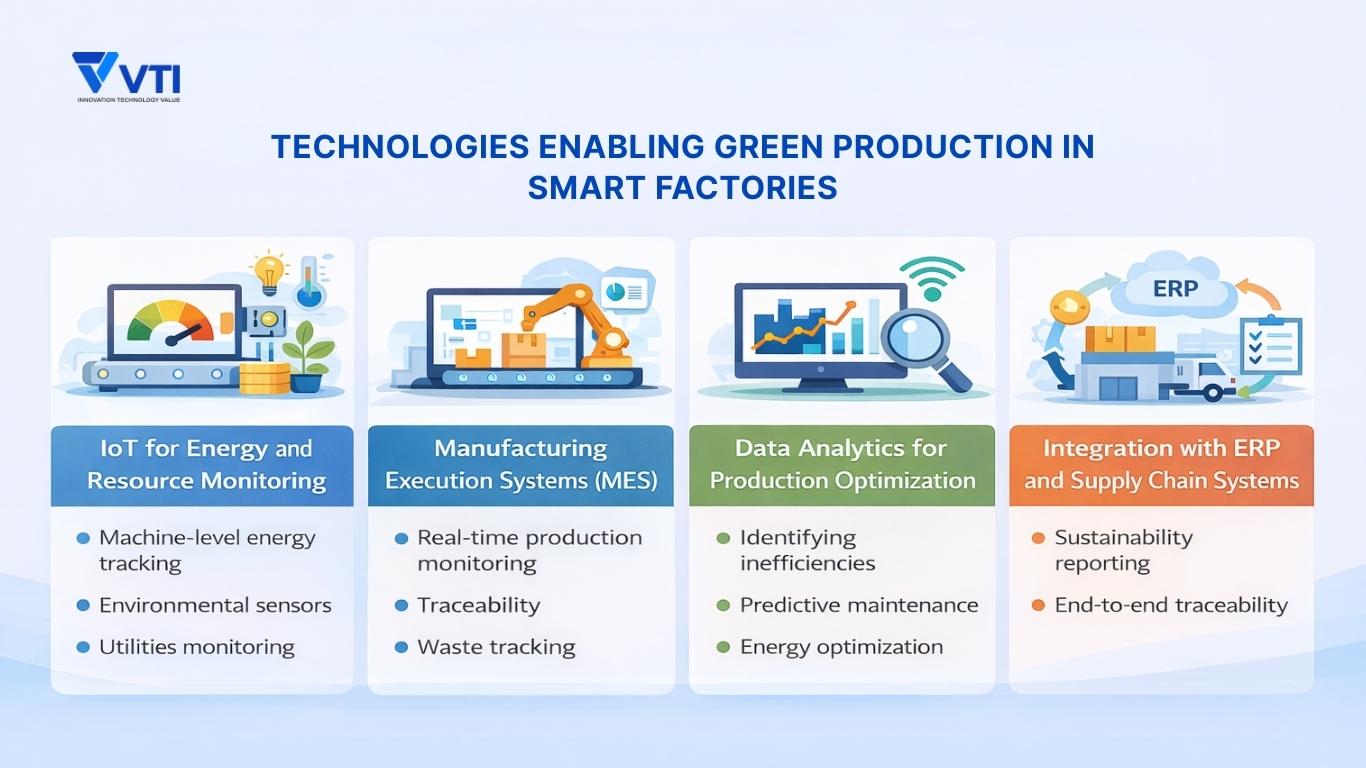
IoT for Energy and Resource Monitoring
IoT-based monitoring transforms energy management from a periodic reporting exercise into a continuous operational discipline. By deploying smart meters, current transformers, and environmental sensors at machine and utility level, factories gain granular visibility into consumption patterns that aggregate monitoring cannot provide.
At the machine level, energy tracking identifies which assets are consuming above performance baseline, when idle-state losses occur, and how consumption varies across shifts, operators, and product types. At the utility level, sub-metering of compressed air, cooling water, and HVAC systems surfaces auxiliary consumption that often represents 20 to 35 percent of total facility energy use — largely invisible in conventional monitoring setups.
When energy data is visible in the same operational context as throughput and yield, it becomes a production variable that line managers act on — not a sustainability metric reviewed monthly by a separate team.
Manufacturing Execution Systems (MES)
MES is the operational layer that connects green production intent to shop floor reality. Without real-time production data from the line, sustainability targets remain aspirational — there is no reliable mechanism to measure progress or attribute environmental performance to specific processes.
- Real-time production monitoring provides the consumption and output data needed to calculate production-normalized environmental metrics — energy per unit, scrap rate by product family, material yield by process. These figures cannot be credibly produced from ERP data alone.
- Traceability at batch and component level enables factories to link quality outcomes, material consumption, and process parameters to specific production events. When yield loss or scrap spikes occur, traceability makes root cause analysis faster and more precise — supporting both waste reduction and audit readiness.
- Waste tracking integrated into MES workflow captures scrap at point of generation by machine, operator, and defect code — not at end-of-line reconciliation. This granularity separates factories that manage waste from those that merely report it.
Discover MESX - real-time visibility for sustainable manufacturing
Gain full visibility across your shopfloor, optimize resource usage, and support ESG and carbon reporting with accurate production data.

Data Analytics for Production Optimization
Raw production and energy data has limited value without the analytical layer that converts it into actionable decisions.
Identifying inefficiencies — correlating energy consumption with output, shift patterns, and equipment age surfaces the specific conditions where resource intensity is highest. A small number of assets, shifts, or product configurations typically account for disproportionate share of total consumption variance.
Predictive maintenance reduces both unplanned downtime and the energy penalty from degraded equipment. A motor with bearing wear, a compressor with a developing leak, or a heating element with reduced efficiency all consume more energy than designed — often for weeks before failure. Condition monitoring catches these deviations early.
Energy-optimized scheduling uses consumption data to inform production sequencing — grouping energy-intensive operations, avoiding simultaneous peak loads, and aligning high-consumption processes with off-peak tariff windows.
Integration with ERP and Supply Chain Systems
Shop floor green production data delivers full value only when it flows upstream into ERP and supply chain systems — connecting operational performance to financial reporting, procurement decisions, and customer-facing sustainability commitments.
Sustainability reporting requires production-level data that is traceable, consistent, and audit-ready. When shop floor data feeds directly into ERP — with energy consumption, waste volumes, and emissions tied to production orders — sustainability reporting becomes a byproduct of normal operations, not a separate data collection effort.
End-to-end traceability across the supply chain helps manufacturers track the environmental footprint of purchased materials alongside production emissions. This provides the Scope 3 visibility that global OEM customers increasingly require.
With ERP integration, factories can connect data across the entire production lifecycle. This includes inbound material sourcing, production processes, and outbound delivery. As a result, traceability becomes operationally feasible rather than a manual reporting exercise.
A Practical Roadmap for Implementing Green Production
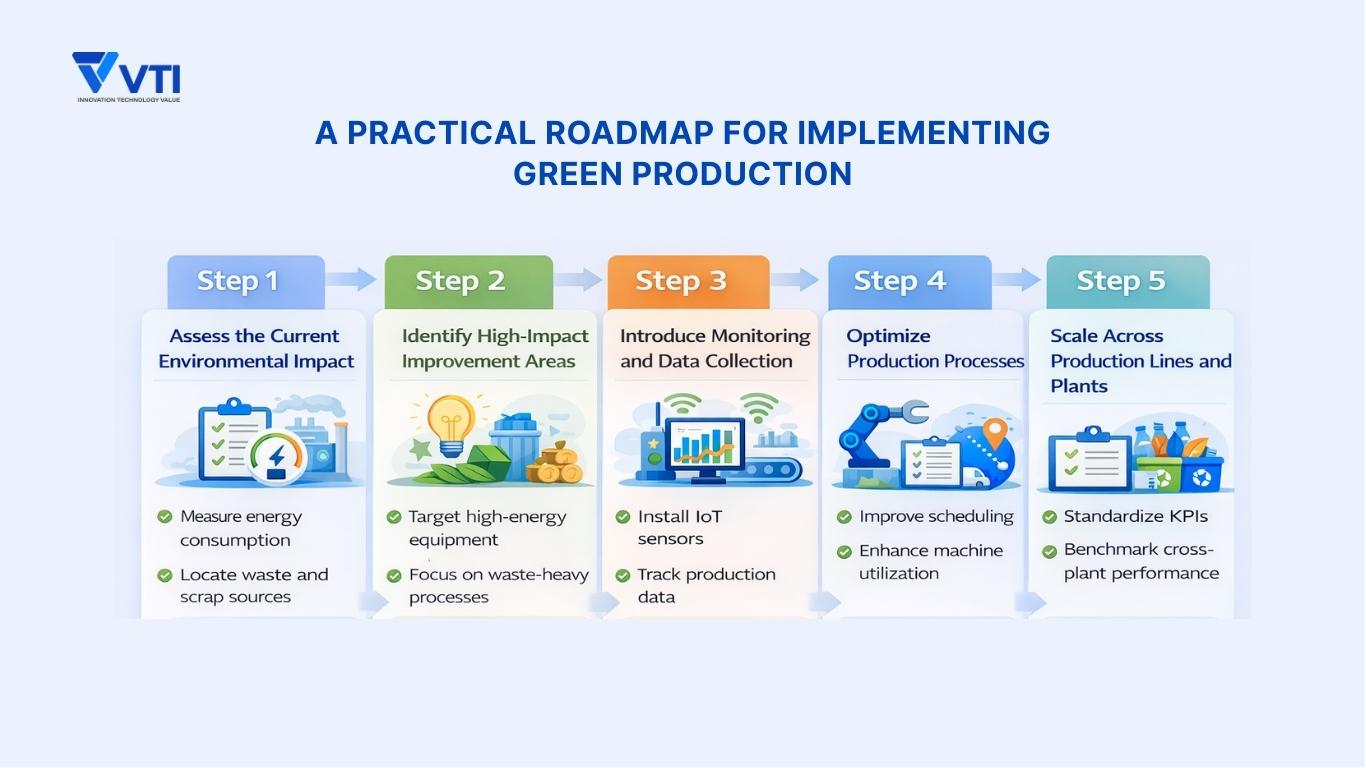
Step 1: Assess the Current Environmental Impact
Before setting targets or selecting technologies, factories need an accurate baseline. This means quantifying three things:
- How much energy is consumed
- Where, where waste and scrap are being generated across the production process
- What emission and effluent outputs the facility is currently producing
For most APAC factories, this baseline does not yet exist in a usable form. Energy data is available at the facility level but not by asset or production line. Waste is tracked by disposal volume, not by originating process. The first step is not improvement — it is measurement. Without a credible baseline, there is no way to prioritize investments, track progress, or substantiate claims to customers and auditors.
Step 2: Identify High-Impact Improvement Areas
Not all processes contribute equally to environmental load. A structured prioritization — mapping energy consumption intensity, scrap generation rate, and emissions output by production area — typically reveals that a small number of assets or process steps account for a disproportionate share of total environmental impact.
In practice, industry data shows that 20–30% of machines in a factory often account for 60–70% of total energy consumption. Similarly, a small number of process steps typically generate the majority of scrap and material loss.
High-energy equipment operating above its designed consumption envelope, processes with chronic yield losses, and utilities running with undetected leakage are consistently the highest-return targets. Focusing initial improvement efforts on these concentrations delivers faster, more measurable results than distributing effort broadly across the facility.
Step 3: Introduce Monitoring and Data Collection
With priority areas identified, the next step is deploying the instrumentation needed to monitor them in real time. This typically means sub-metered energy monitoring at the machine or line level, IoT sensors on high-consumption utilities, and integration of production output data from MES or shop floor control systems.
The objective at this stage is targeted visibility in the areas where improvement decisions will be made. A phased instrumentation approach, starting with the highest-impact assets identified in Step 2, limits upfront investment while generating the operational data needed to justify broader rollout.
Step 4: Optimize Production Processes
With monitoring in place and data flowing, process optimization becomes data-driven rather than assumption-based. Three levers consistently deliver results at this stage.
- Scheduling improvements — restructuring production sequences to consolidate energy-intensive runs, reduce warm-up and cooldown cycles, and shift peak-load operations to off-peak tariff windows. The energy savings from scheduling optimization require no capital investment — only the analytical capability to connect consumption data to planning decisions.
- Machine utilization — using consumption data to identify equipment running below productive output relative to energy draw, and adjusting shift patterns, maintenance schedules, or production routing to improve the ratio of value-added output to energy consumed.
- Scrap reduction — applying root cause analysis to the waste data captured in Step 3, targeting the defect types and process conditions that generate the highest material loss, and implementing parameter controls that hold processes within their optimal operating range.
Step 5: Scale Across Production Lines and Plants
For multi-plant manufacturers, scaling green production requires converting site-level programs into a standardized operational framework that can be applied consistently across facilities.
Standardizing KPIs — establishing a common set of production-normalized environmental metrics (energy per unit, scrap rate, water per batch, carbon per output) across all sites creates a shared performance language. Without standardization, cross-site comparisons are unreliable and regional reporting to parent companies or global customers becomes a reconciliation exercise rather than a management tool.
Cross-plant benchmarking — once KPIs are standardized, performance gaps between sites become visible and actionable. A facility consuming significantly more energy per unit than a comparable plant in the same network is a candidate for targeted intervention, knowledge transfer, or investment prioritization. Benchmarking transforms green production from a site-level initiative into a network-level competitive discipline.
Key Metrics for Measuring Green Production Performance
Energy Consumption per Unit Produced
The primary metric for tracking production energy efficiency. Expressed as kWh per unit or kWh per production hour, this metric normalizes energy consumption against output volume — making it comparable across shifts, product mixes, and facilities. It is the foundational KPI for energy reduction programs and is increasingly required in customer sustainability scorecards and ESG disclosures.
Material Yield and Scrap Rate
Material yield — the proportion of input material converted into conforming output — and its inverse, scrap rate, measure how efficiently a production process converts raw material into saleable product. Both metrics should be tracked by product family, process step, and production line to enable targeted improvement. In material-intensive sectors, a one percent improvement in yield typically delivers more environmental and cost impact than an equivalent reduction in energy consumption.
For example, in a factory consuming $10M/year in raw materials, a 1% yield improvement can save approximately $100,000 annually — while also reducing waste and emissions.
Water Usage per Production Batch
For water-intensive industries such as food and beverage processing, semiconductor fabrication, surface treatment, and chemicals, water consumption per production batch is a critical operational and regulatory metric. Production-normalized water tracking helps identify which process steps consume disproportionate volumes. It also supports compliance with discharge limits and provides reliable data for water reduction targets.
In addition, this data is increasingly required for third-party sustainability reporting and customer audits.
Carbon Emissions per Production Output
Calculated from energy consumption data, fuel usage, and process emissions, carbon intensity per unit of production output is the metric that connects factory-level operations to corporate ESG targets and customer Scope 3 reporting requirements. As carbon disclosure obligations expand across APAC, production-level carbon intensity data will become a standard operational metric rather than an annual reporting exercise.
The Future of Green Production in Smart Manufacturing
AI-Driven Energy Optimization
AI-based energy management moves beyond historical monitoring into predictive optimization — using consumption patterns, production schedules, equipment condition data, and external variables such as energy tariff structures to recommend or autonomously execute energy use decisions in real time. Rather than identifying waste after it has occurred, AI-driven systems anticipate demand spikes, adjust equipment operating parameters proactively, and optimize the sequencing of energy-intensive operations across the production schedule.
Carbon-Aware Production Planning
The next evolution of production scheduling incorporates carbon intensity as a planning variable alongside capacity, material availability, and delivery requirements.
Carbon-aware planning enables manufacturers to sequence production in ways that minimize emissions per unit. For example, factories can shift high-intensity operations to periods when grid electricity is cleaner. They can also consolidate production runs to reduce equipment cycling losses.
In addition, manufacturers can generate carbon cost data at the order level to support customer reporting and internal carbon accounting. As carbon pricing mechanisms expand across APAC jurisdictions, this capability is becoming increasingly important. As a result, optimizing production against carbon cost constraints will shift from a competitive advantage to a standard planning requirement.
Fully Integrated Sustainable Factories
The endpoint of the green production trajectory is a factory where production management embeds sustainability directly into operational systems, KPIs, and daily decision-making — rather than treating it as a separate program managed by an environmental team.
This is where an Energy Management System (EMS) becomes essential. An EMS connects energy data with production data, allowing factory managers to monitor, analyze, and optimize consumption in the same way they manage OEE, quality, and output.
Energy, waste, water, and carbon metrics sit alongside OEE, OTIF, and yield in the same operational dashboards. Sustainability performance is reviewed in the same production meetings as throughput and quality. Environmental data flows automatically into customer reporting and regulatory submissions without manual assembly.
Manufacturers across APAC that have systematically built the monitoring infrastructure, MES connectivity, and data analytics capability described in this guide are already operating at or near this standard. The gap between current state and fully integrated sustainable manufacturing is, for most factories, a structured implementation roadmap.
Conclusion
Green production has moved well beyond its origins as an environmental compliance discipline. For APAC manufacturers competing in global supply chains, it is now a core operational strategy that simultaneously reduces energy and material costs, and builds the data infrastructure that modern manufacturing management requires.
The factories that will lead on sustainability over the next decade are not those that treat it as a separate initiative. They are the ones that integrate green production principles into how they plan, execute, and measure operations every day.
FAQs
What is green production?
Green production refers to manufacturing practices designed to reduce environmental impact while maintaining efficient production operations.
What are the benefits of green production?
Benefits include:
- Reduced energy costs
- Lower material waste
- Improved regulatory compliance
- Stronger sustainability reputation.
How can factories implement green production?
Factories typically start by measuring energy consumption and waste levels. Then, they optimize production processes using technologies such as IoT monitoring systems and MES. This approach enables data-driven improvements across operations.
What technologies support green production?
Key technologies include:
- IoT sensors
- Energy monitoring systems
- MES platforms
- Data analytics tools.
Is green production the same as green manufacturing?
Green production focuses on improving environmental performance within production processes. In contrast, green manufacturing covers broader sustainability initiatives across the entire factory. It includes infrastructure, supply chain, and environmental management systems.