![[FREE EBOOK] Strategic Vietnam IT Outsourcing: Optimizing Cost and Workforce Efficiency](https://vti.com.vn/wp-content/uploads/2023/08/cover-mockup_ebook-it-outsourcing-20230331111004-ynxdn-1.png)
Are you tired of unpredictable IT costs that seem to spiral out of control just when your business needs stability most? You’re not alone. Many business leaders struggle to understand managed IT services pricing, often finding themselves caught off guard by hidden fees or locked into models that don’t match their actual needs.
5 Must-Adapt IT Operations Trend Before 2030
This ebook provides a clear, executive-level perspective on 5 forces redefining IT operations in the next 5 years. The strategic decisions leaders must act now to stay ahead.
Download for Free
Drawing on our experience as a managed service provider, we have built this guide to break down the four core pricing models, showing you exactly how MSPs calculate costs and suggesting ways to choose the right approach for your organization.
After this, you’ll discover what vendors don’t always tell you about effort calculations, hidden costs to watch for, and so on.
6 Key Factors Influencing Managed IT Service Pricing
Managed application services pricing extends far beyond the advertised monthly fee. Service complexity, infrastructure scale, and specific business requirements create significant cost variations.
Understanding these factors helps CxOs accurately budget for managed services investments and avoid unexpected expenses.
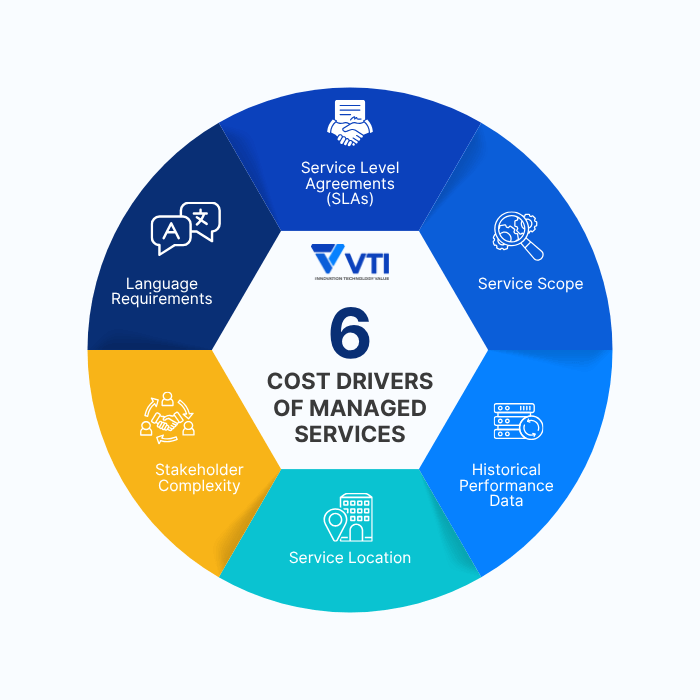
1. Service level agreements (SLAs)
SLAs significantly impact your monthly costs by defining the quality and responsiveness of your managed service. Stricter SLAs naturally lead to higher pricing because they require additional staffing, redundancy, and monitoring capabilities.
Key SLA factors include response and resolution time commitments, uptime or availability guarantees, penalty/bonus schemes tied to performance, on-call or 24/7 support requirements, and defined KPIs with reporting matrices.
For example:
- Basic business-hours (9-5) support costs substantially less than 24/7 coverage with guaranteed response times.
- Switching from business-hours coverage to full 24/7 on-call support can increase total costs by 30–50%, depending on region and skill requirements.
- Additional services like cybersecurity monitoring, backup management, and compliance reporting typically add 20-50% to base pricing.
2. Service Scope Determines Your Baseline Cost
The foundation of any managed IT services pricing lies in what’s included. The number of applications, their complexity, and the size of your IT environment directly influence monthly costs. Managing a simple HR system differs fundamentally from supporting a multi-layered ERP with integrations across regions.
Each additional application or custom integration adds to workload, monitoring, and reporting requirements – increasing both effort and risk. Providers typically assess the number of applications under management, complexity, and size of each (users, modules, integrations, data volume), and technical architecture requirements.
Enterprises with 10–20 business-critical applications (ERP, CRM, MES, WMS) often require multi-tiered support models and dedicated engineers, pushing costs toward the upper pricing bracket. Organizations requiring specialized expertise for legacy systems or proprietary software face premium pricing due to skill scarcity in the market.
3. Historical Performance Data Shapes Your Quote
Managed service providers rely heavily on your historical IT performance data to estimate future workloads and price accordingly. They analyze the number of tickets by priority (P1–P3), tickets occurring within versus outside business hours (nights, weekends), and average resolution time per priority level.
Change requests (CRs) handled – categorized as standard, normal, or emergency – over the past 12–24 months help providers anticipate future demand. The frequency and severity of outages over the last two years, including whether they occurred within or outside service hours and their root causes, factor into risk assessments.
Higher volumes of after-hours incidents, frequent change requests, or emergency fixes all signal greater resource demand and operational risk – resulting in higher monthly rates.
Organizations with higher historical incident volumes or complex outage patterns typically face 15-25% higher managed service fees.
4. Service Location Balances Cost and Responsiveness
Where services are delivered also significantly shapes your pricing structure, as labor costs vary significantly across markets. For instance, Singapore and Australia typically command premium rates due to higher living costs and demand for skilled IT professionals, while emerging markets like Vietnam offer more competitive pricing.
Not to mention currency fluctuations or local market competition (countries with more provider density often have more competitive rates).
Therefore, it is better to consider each of the following delivery models to balance the cost, responsiveness, and collaboration depth differently:
- Offshore (Remote): The lowest cost option, ideal for monitoring and standard operations. However, latency and time zone differences may affect real-time collaboration and emergency response capabilities.
- On-site: Higher costs but ensures immediate response and deeper integration with in-house teams. Common for industries with strict data handling or regulatory requirements, where physical presence provides tangible value.
- Hybrid: Combines both models – remote support for standard tasks and local engineers for escalations or strategic work. Provides flexibility and cost efficiency while maintaining critical on-ground capabilities.
For example, a Singaporean enterprise might use offshore monitoring from Vietnam, complemented by on-site support during major system rollouts – achieving both cost savings and operational reliability.
5. Stakeholder Complexity Adds Management Overhead
The number of parties managing or depending on IT services adds coordination complexity that providers must account for.
MSPs consider internal departments, which are involved under operational level agreements (OLAs), and external suppliers/subcontractors needed to coordinate.
More involved parties mean more reporting, governance, and escalation layers – often adding 10–15% to management overhead.
Multi-vendor environment management increases administrative overhead, resulting in 20-30% higher fees compared to standardized single-vendor deployments. Clear role definitions and communication channels help minimize duplication and ensure accountability.
6. Language Requirements in Regional Markets
Language support represents a growing cost factor in regional or multinational environments.
Providers must secure engineers fluent in specific languages – sometimes with certified proficiency, such as JLPT for Japanese, TOPIK for Korean, or equivalent business-level English.
The number of languages supported and the required proficiency level (basic versus advanced) directly affect staffing costs.
Providing bilingual Japanese-English support can raise costs 10–25% due to talent scarcity in specialized technical roles, while multilingual support for customer-facing or compliance-heavy environments increases operational complexity even further
How To Calculate Managed Service Effort?
Download Free MSP Cost Estimator Template
A simple, powerful template to calculate your managed service expense. Just input your design market, service scope, device count, and support levels, and instantly get your Cost Per Ticket and country-specific benchmark.
Get Free Template
Managed application services pricing relies on sophisticated calculation models that vendors use to determine service delivery expenses and resource allocation.
Understanding these calculations helps CxOs evaluate whether quoted prices reflect true operational demands or inflated margins.
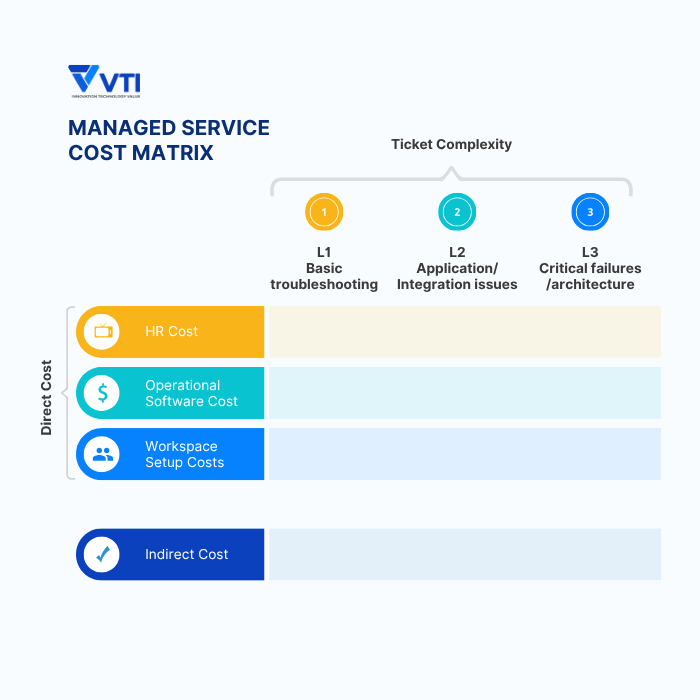
Direct Costs of Managed Services
The majority of the managed IT services pricing comes from these costs that are tied to service delivery. They form the baseline of any managed services quote.
- HR Costs:
Labor represents the largest cost component in any managed services arrangement. Vendors calculate labor costs per shift based on hourly rates multiplied by shift duration.
For example, at $25 USD/hour for an 8-hour shift, labor cost reaches $200 USD per shift. Providers then allocate this across expected ticket volumes – if a team handles 40 tickets per shift, the labor cost per ticket equals $5 USD.
This calculation scales based on your service requirements: 24/7 coverage requires three shifts daily, while business-hours support needs only one or two shifts, directly impacting your monthly fees.
- Workspace Setup Costs:
For dedicated on-site or hybrid arrangements or offshore projects with ODC setup requirements, seating & equipment infrastructure costs may be included.
Vendors calculate technology and facility costs per shift by dividing total infrastructure investment by the number of shifts over the contract period.
For instance, $20,000 USD in setup costs spread across 90 shifts equals $222.22 USD per shift, or $5.56 USD per ticket when handling 40 tickets per shift.
These costs typically appear as one-time setup fees ($5,000-50,000) rather than recurring charges, though some providers amortize them across contract duration.
- Operational Software Costs:
Depending on your systems, additional fees for communication tools (Skype, Microsoft Teams), ticketing systems (ServiceNow, Jira), and monitoring platforms represent ongoing software expenses.
Vendors may bundle these into base pricing or charge them separately, particularly for specialized tools required for your specific applications.
Standard tool costs typically add 5-10% to base labor rates, while specialized monitoring solutions can add 15-25%.
Indirect Costs: The Hidden Overhead
Beyond direct service delivery, vendors must cover organizational overhead that supports quality and compliance.
These indirect costs typically add 20-35% to direct costs but often remain invisible in managed IT services pricing breakdowns.
For example, back-office functions, including quality assurance, IT infrastructure management, project management offices (PMO), and compliance maintenance, all factor into vendor pricing.
Maintaining security certifications (ISO 27001, SOC 2), conducting regular audits, and ensuring regulatory compliance require dedicated teams that don’t directly touch your applications but ensure service quality and risk management.
For example, a vendor’s quality assurance team might review 10% of all resolved tickets, adding approximately $1-2 USD per ticket to ensure service standards.
Compliance management for regulated industries (BFSI, healthcare) can add another 15-25% to base costs due to specialized documentation, audit trails, and certified personnel requirements.
Ticket Complexity: The L1/L2/L3 Framework
Above is just one dimension of the calculation matrix. Another is divided by L1/L2/L3 tier framework.
Because not all incidents require the same effort or expertise. Vendors use a tiered model that significantly impacts pricing calculations. This includes:
- Level 1 (L1) – First-Line Support: These involve basic troubleshooting, password resets, user access issues, and standard configuration questions. L1 tickets typically require 30-60 minutes to resolve and are handled by junior engineers or support specialists. Vendors may assign a baseline multiplier of 1.0x in their cost calculations.
- Level 2 (L2) – Technical Support: Mid-complexity issues, including application errors, integration problems, performance degradation, and non-standard configurations. L2 tickets require deeper technical knowledge, often involving senior engineers with application-specific expertise. Resolution times average 2-4 hours. Vendors apply a 2.5x complexity multiplier to L2 tickets, meaning each L2 incident costs 2.5 times an L1 ticket to resolve.
- Level 3 (L3) – Expert Escalation: High-complexity incidents involving architectural issues, critical system failures, security breaches, or problems requiring vendor collaboration. L3 tickets demand specialist expertise, extensive investigation, and often coordination across multiple teams. Resolution can take 8-16 hours or more. These carry a 4.0x multiplier – one L3 ticket consumes resources equivalent to four L1 tickets.
(Note: The weighted number here is just for reference. Depending on vendors, the figure can vary.)
Why This Matters for Your Pricing: If your historical data shows 60% L1, 30% L2, and 10% L3 distribution, vendors calculate weighted effort accordingly. For 100 monthly tickets: (60 × 1.0) + (30 × 2.5) + (10 × 4.0) = 175 weighted tickets. This means you’re actually paying for 175 “L1-equivalent” tickets worth of effort, not just 100 tickets.
Organizations with higher L2/L3 ratios face steeper pricing because they require more experienced staff and longer resolution times. This is why vendors analyze your historical ticket data carefully – your incident complexity profile directly determines their resource allocation and pricing structure.
What are the 4 managed service pricing models? Which one is best for you?
When evaluating managed IT services pricing for your organization, there could be tons of models out there. But, here are 4 primary models that top vendors are using, including:
- Time & materials,
- Per-server,
- Per-application,
- Request-based.
Each offers distinct advantages depending on your infrastructure needs, budget predictability requirements, and operational complexity.
Time & Materials Model
In this model, you’re billed by the hour for the work your Managed Service Provider (MSP) performs. Rates typically range from $25–150/hr for the Southeast Asia Region, or $100 to $250 per hour in markets like Australia, Singapore, or Japan, depending on the complexity of the work and the skill level required.
This is the most flexible and transparent pricing structure – you pay only for what’s delivered. It fits organizations with unpredictable IT needs or those running short-term or digital transformation projects. It also works well when you’re testing a new MSP relationship before committing to a long-term contract.
However, the downside is that costs can fluctuate. If your IT workload suddenly increases, so does your bill. Especially in the long-term, Time & Materials models typically show 20-30% cost variation annually based on actual workload demands, making budget forecasting challenging over a 3-5 year period.
Best for: Businesses with variable or project-based IT needs that value flexibility over fixed budgets.
Per-Server Pricing
Here, you pay a fixed monthly fee for each server under management – usually between $50 and $200 per server. This straightforward model makes budgeting predictable and scales easily as your infrastructure grows.
IT leaders like this approach because it directly ties costs to their number of servers, making chargeback to departments or cost centers simple. Per-Server pricing provides predictable monthly costs over a 3-5 year period, offering excellent budget stability.
It’s especially effective for organizations with stable, on-premise data centers or private cloud environments where the server count doesn’t change often.
The challenge comes with cloud-based or fast-scaling environments, where server numbers can fluctuate. For example, a company starting with 30 servers that scales to 100 servers within three years may see its monthly costs triple from $9,000 to $30,000 or more.
It’s essential to negotiate volume discounts at specific server count milestones (e.g., 50, 100, 200 servers) to maintain cost efficiency as you scale.
Also, in such cases, many companies choose a hybrid approach, mixing per-server pricing with usage-based cloud billing.
Best for: Traditional enterprises or data center-heavy organizations in Australia or Singapore with stable, standardized infrastructure.
Per-Application Pricing
In this model, pricing is based on the specific business applications the MSP manages – such as ERP, CRM, or core banking systems. Costs typically range from $500 to $5,000 per application per month, depending on the app’s size, complexity, and required uptime or compliance level.
Application-centric organizations should think of Per-Application pricing when 80% of the IT budget focuses on specific software platforms. In 3-5 years, this provides exceptional budget predictability for organizations that maintain consistent application portfolios. Even if you scale your infrastructure (adding servers, users, or data volume), your managed services costs remain stable as long as the core applications don’t change.
Therefore, the model is popular in finance, manufacturing, and logistics, where certain applications are mission-critical and need dedicated support.
The trade-off is administrative complexity. To avoid billing disputes, you need clearly defined service levels (SLAs) and application boundaries.
Best for: Organizations with a few critical business applications that require specialized care and compliance.
Request-based model
The request-based model works like a prepaid service package. You buy a set number of service requests (or “tickets”) each month, often reviewed and adjusted every six months to match actual usage.
It’s ideal for companies with predictable and stable support needs.
For example, maintaining existing systems or handling routine maintenance. This model offers clear budgeting and cost control, since you know exactly how many requests you’re paying for.
However, it’s less flexible when your IT workload suddenly increases. If more issues or change requests arise, additional fees may apply. For that reason, it’s not the best fit for rapidly changing or fast-scaling environments, especially in the long term.
Best for: Organizations with steady, predictable IT support needs – such as maintenance or helpdesk operations.
Download Free MSP Cost Estimator Template
A simple, powerful template to calculate your managed service expense. Just input your design market, service scope, device count, and support levels, and instantly get your Cost Per Ticket and country-specific benchmark.
Get Free TemplateSelecting Your Optimal Pricing Strategy
The optimal managed service provider pricing depends on predictability needs, infrastructure maturity, and growth patterns. So, it is hard to say for sure which model is the best.
Yet, we can make it easier for you to decide with a comparison matrix of the 4 models:
| Pricing Model | Company Size | IT Complexity | Budget Predictability | Long-Term Cost Pattern | Best Use Case |
| Time & Materials | Small to large, flexible | High or unpredictable | Low to moderate | 20-30% annual variation; unpredictable but flexible | Projects with variable workloads or digital transformations |
| Per-Server Pricing | Medium to large | Low to moderate | High | Highly predictable; scales linearly with server growth | Stable server infrastructure with predictable growth |
| Per-Application Pricing | Medium to large | High (regulated industries) | Moderate to high | Very stable; unchanged by infrastructure growth | Business-critical regulated apps requiring dedicated support |
| Request-Based | Small to medium | Low | High (initially) | 15-25% annual increase as usage grows | Stable applications with predictable, low support requests |
Hybrid Approaches for Optimal Cost Control
Each model has strengths and weaknesses; therefore, as suggested by TechTarget, a hybrid model is also an option if you want to combine models’ merits.
Such hybrid approaches combining multiple pricing models offer optimal cost control for complex enterprise environments. Organizations can:
- Use Time & Materials for transformation projects while maintaining Per-Application pricing for stable, critical systems
- Combine Per-Server pricing for on-premise infrastructure with cloud-based usage billing for dynamic workloads
- Start with Request-Based support for predictable operations while using Time & Materials for strategic initiatives
The key is to look beyond surface-level pricing and evaluate how each model supports your operational goals, risk tolerance, and long-term strategy over a 3-5 year horizon.
Final words
Choosing the right managed IT services pricing model isn’t just about finding the lowest monthly fee – it’s about aligning costs with your business needs and growth trajectory. Whether you opt for the flexibility of time & materials, the predictability of per-server pricing, or the business-focused approach of per-application models, success comes from understanding the total cost of ownership and hidden factors that impact your budget.
The key is to look beyond surface-level pricing and evaluate how each model supports your operational goals, risk tolerance, and long-term strategy. Take time to assess your current IT demands, projected growth, and budget predictability needs. With the right approach, managed IT services can deliver the 20-30% cost savings and improved reliability that drive real business value – but only when you choose a pricing model that truly fits your organization.
VTI’s AI-powered Managed Service blends intelligent automation with Human-in-the-Loop expertise. With ITIL-aligned and backed by strong compliance experience, VTI offers flexible operating models and adaptive shift coverage (24/7, after-hours,…) for secure, reliable application operations. Contact us today to explore a customized, AI-driven managed service built around your business needs.
FAQ
Why is calculation mostly based on Tickets?
Even though we mentioned 4 managed IT services pricing models before, such as “per application” or “per server”, the calculations are mostly ticket-based or shift-based. You will wonder why.
Actually, every support request, whether a password reset or a critical system failure, consumes the vendor’s certain amount of resources in labor time, tools, and overhead.
By using tickets as a unit, it is easier for vendors to measure volume and complexity, which helps determine how many engineers must staff, what skill levels they need, and how much infrastructure they must maintain.
And this also explains why vendors request your historical data before quoting. They’re analyzing your past ticket patterns to forecast future workload.
Are there any hidden fees or surprise charges I should be aware of?
No, not in a truly managed model. Reputable MSPs offer predictable, fixed monthly pricing that covers all agreed-upon services. Any costs outside the contract (like major hardware purchases or specific project work) are always quoted and approved by you beforehand.
How can I justify the cost of Managed IT Services compared to hiring an in-house IT person?
Managed IT Services offer a full team of experts (security, network, cloud, etc.) for less than the cost of a single experienced, salaried employee. You save on salary, benefits, training, and the risk of relying on one person’s limited knowledge and availability.
How do managed IT services help my business save money in the long run?
It offers predictable budgeting (fixed monthly cost) and minimizes expensive downtime. Proactive maintenance prevents major issues and costly emergency repairs, while also boosting staff productivity by resolving issues faster.”