![[FREE EBOOK] Strategic Vietnam IT Outsourcing: Optimizing Cost and Workforce Efficiency](https://vti.com.vn/wp-content/uploads/2026/06/ebook-it-outsourcing.png)
It is a fact that inventory cost is always perceived as a hidden drain on profitability rather than a growth driver. Surely, a certain number of businesses across Asia have shared the same thought. However, in the current business competition, where every aspect accumulates your advantages, giving up and accepting it is never sensible. Instead, a more sensible option is to find how to improve inventory turnover and turn it into something that paves the way for your future success. I’m glad that you’re here and looking for that question.
The solution lies in understanding and optimizing your inventory turnover, a critical metric that reveals how efficiently your business converts stock into revenue. In this comprehensive guide, you’ll discover how to calculate inventory turnover ratios, interpret industry benchmarks, and identify the key factors that impact your performance.
More importantly, you’ll learn practical strategies to transform slow-moving inventory into a competitive advantage, including how modern technology can streamline your entire inventory management process. Whether you’re managing retail operations in Asia or anywhere, mastering inventory turnover is essential for sustainable business growth.
How Do You Calculate Inventory Turnover?
What do you mean by inventory turnover?
Inventory turnover is a critical financial metric that measures how frequently a company sells and replaces its inventory within a specific timeframe, directly impacting efforts to improve inventory turnover efficiency.
This calculation reveals whether your business maintains optimal stock levels or experiences low inventory turnover that ties up working capital unnecessarily.
The formula to calculate Inventory Turnover
The fundamental inventory turnover formula calculates this ratio by dividing the Cost of Goods Sold (COGS) by the average inventory value (the mean value of a company’s inventory over a specific period):
| Inventory Turnover = COGS ÷ Average Inventory. |
Based on the formula, we know exactly step by step to calculate inventory turnover ratios effectively.
Begin by determining your COGS for the measurement period. Typically, annual figures provide the most comprehensive analysis.
Next, compute the average inventory by adding the beginning inventory value to the ending inventory value of a certain period (month, quarter, year), then dividing by 2 to account for seasonal fluctuations and demand variations.
| Average Inventory= (Beginning Inventory+Ending Inventory)/2 |
For example, if your annual COGS equals $200,000 and average inventory totals $50,000, the resulting turnover ratio of 4 indicates inventory cycles four times annually.
Accordingly, you can simply interpret the results like this: The higher the turnover ratio, the more inventory cycles happen, and vice versa.
This calculation method provides accurate insights into inventory management effectiveness by focusing on actual costs rather than retail prices, eliminating markup distortions (the amount added to a product’s cost to determine its selling price) that could skew analytical results.
Understanding this formula enables decision-makers to evaluate their inventory stock turnover performance against industry benchmarks (mentioned later) and identify optimization opportunities and trends within their supply chain operations.
What Happens When Inventory Turnover Is High?
When inventory turnover soars, businesses typically experience several compelling advantages.
First and foremost, cash flow improves dramatically. Instead of money sitting idle in warehouse products, it circulates back into operations quickly. Think of it like a revolving door – the faster products move out, the quicker fresh revenue streams in.
Moreover, high turnover significantly reduces carrying costs. Storage fees, insurance premiums, and warehouse maintenance expenses shrink when products don’t linger on shelves. Additionally, businesses face minimal risk from obsolete or expired inventory, which is particularly crucial for companies dealing with perishable goods or rapidly evolving technology products.
Customer satisfaction often increases as well, since high turnover usually indicates strong demand and product availability. When inventory moves quickly, it suggests that businesses are successfully meeting market needs and maintaining fresh stock.
The Hidden Challenges
However, exceptionally high inventory turnover isn’t always purely beneficial. Sometimes it signals underlying operational strain. Businesses might struggle with frequent stockouts, disappointing customers who encounter empty shelves or backorders. This scenario is like a popular restaurant that consistently runs out of signature dishes, initially flattering, but ultimately frustrating for patrons.
Furthermore, companies with extremely high turnover may miss bulk purchasing opportunities that could reduce unit costs. They might also face increased administrative burden from frequent reordering and supplier management.
Therefore, the key lies in achieving optimal inventory turnover rather than maximum turnover. Understanding your sector’s standards helps determine whether your turnover rate represents healthy efficiency or potential concern.
(And don’t worry, the benchmark for your industry will be mentioned in the later part.)
What Happens If Inventory Turnover is Low?
In contrast, when businesses experience low inventory turnover, capital becomes tied up in unsold stock. This leads to significant cash flow constraints that limit operational flexibility and growth opportunities.
This scenario forces decision-makers to maintain higher working capital requirements while generating lower returns on invested resources.
Moreover, low inventory turnover directly impacts profitability. Because it amplifies warehousing and storage expenses, such as additional insurance, depreciation, labor expenses, and obsolescence expenses. Magestore’s analysis demonstrates that prolonged inventory holding periods can reduce overall profitability by 15-25% compared to businesses maintaining optimal turnover rates.
Furthermore, poor turnover performance complicates demand forecasting and procurement planning processes. It becomes more challenging to identify optimal order quantities and timing. This complexity often leads to passive rather than proactive strategic inventory management approaches.
Last but not least, excess inventory also creates opportunity costs by preventing investment in higher-performing products or strategic initiatives that could enhance competitive positioning.
Strategies to Identify and Resolve Low Turnover Issues
Implementing comprehensive inventory turnover dashboard systems enables real-time monitoring of turnover performance across product categories, enabling proactive identification of underperforming inventory before issues become critical. Advanced analytics tools can reveal patterns in slow-moving stock and suggest targeted interventions such as promotional campaigns, bundle offerings, or strategic markdown strategies.
Additionally, businesses can address turnover challenges through supplier relationship optimization, demand planning improvements, and enhanced forecasting methodologies that align procurement decisions with actual market requirements rather than historical assumptions.
Inventory Optimization Through IMS Dashboards
For businesses across Asia, VTI's Inventory Management System provides customizable dashboard tracking and seamless ERP integration to optimize turnover performance.
What is a Good Inventory Turnover Ratio?
Determining optimal inventory turnover ratios requires understanding industry-specific benchmarks that guide strategic decision-making processes.
Generally, ratios between 5 and 10 are considered balanced across most retail sectors, ensuring sufficient stock availability while minimizing excessive storage costs that impact profitability. However, these benchmarks vary significantly by industry. For example:
- Grocery retailers typically maintain turnover ratios of 10-20 due to perishable inventory requirements.
- Fast-moving consumer goods (FMCG) companies often target higher ratios (12-15 or more) to minimize the risk of spoilage and waste, improve inventory turnover efficiency, and reduce working capital requirements.
- Pharmaceutical and automotive suppliers maintain moderate ratios between 4-8 to balance demand fulfillment with regulatory compliance and quality assurance protocols.
- Luxury goods retailers may operate effectively with ratios of 2-4, given longer sales cycles and higher unit values.
Understanding these sector-specific benchmarks enables more accurate performance evaluation and strategic planning.
How can inventory turnover be improved?
What Are the Factors Affecting Inventory Turnover?
To be honest, it will be time-consuming if you don’t know which variables or elements and to what extent they influence your ratios, negatively or positively. Therefore, let’s explore those to have a better comprehension of how you can improve inventory turnover.
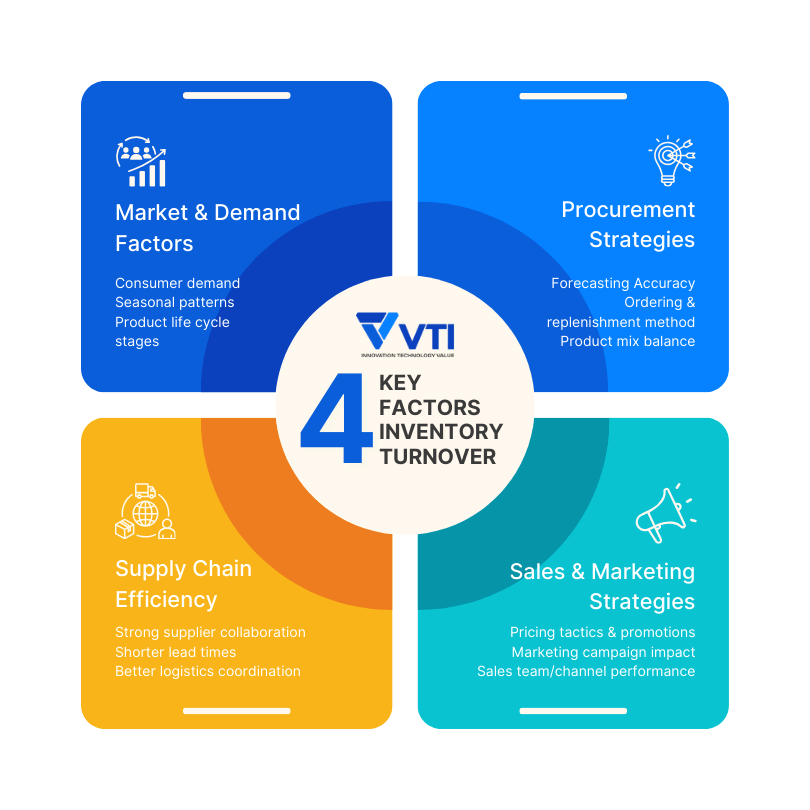
Market and Demand Factors
Some things can be taken into consideration to help you determine your optimal inventory turnover rate, including:
- Consumer Demand: If a product is in high demand, sales volume increases, and inventory turnover will naturally be higher. Conversely, a drop in demand leads to slow sales and a lower turnover rate.
- Seasonality: Many products have predictable sales cycles. F&B restaurant owners, for example, in Japan always experience dramatic demand spikes during holiday seasons like Golden Week. Or fashion retailers across Southeast Asia must navigate monsoon-related purchasing behaviors, influencing seasonal inventory cycling.
- Product Life Cycle: A product’s turnover changes throughout its life cycle. Turnover is often high during the “growth” phase when a product is popular and new, but it declines as the product enters the “decline” phase and becomes obsolete.
- Economic Conditions: Broader economic trends like recessions or booms influence consumer purchasing power. In a recession, consumers may spend less, causing a low turnover for non-essential goods.
Yet, it is worth noting that besides those predictable patterns, there are unpredictable ones that can lead to low inventory turnover scenarios where excess stock accumulates due to overestimation of market requirements.
Luckily, we are in a technology era. Businesses can now utilize advanced analytics and inventory turnover dashboard systems to better anticipate these variations and adjust procurement strategies accordingly to maintain optimal turnover performance.
Procurement Strategies
There are internal strategy factors that a company bases on to regarding its inventory.
- Forecasting Accuracy: Poor demand forecasting can lead to either overstocking or understocking.
- Ordering and Replenishment Procedures: For example, Just-in-time (JIT) procurement approaches can accelerate turnover rates by minimizing on-hand inventory, though this strategy requires reliable supplier networks and precise demand forecasting capabilities. Conversely, bulk purchasing strategies may reduce unit costs but potentially create slower turnover rates due to increased inventory holdings.
- Product Mix and Assortment: The type of products a company carries matters. A company with a large number of slow-moving, high-cost items (e.g., luxury cars or furniture) will inherently have a lower turnover than a company that sells fast-moving consumer goods (FMCG) like groceries.
Supply Chain Efficiency
Another vital factor is supply chain optimization, especially your relationship with suppliers.
A strong collaboration can lead to shorter lead times, allowing a company to order smaller quantities more frequently without the risk of stockouts, followed by improved order accuracy and enhanced logistics coordination. This supports dynamic inventory management and significantly increases turnover, which is particularly important for businesses operating across multiple markets with the requirement of a complex cross-border supply chain.
Research demonstrates that streamlined supply chain processes enable faster inventory replenishment cycles and more responsive demand fulfillment capabilities.
Sales and Marketing Strategies
Finally, the capability to sell its products plays an undeniable role in improving the inventory turnover of a company. Let’s elaborate on it.
- Pricing Strategy: A high product price might slow down sales, thus lowering inventory turnover. On the other hand, promotional pricing, sales, or discounts can accelerate sales and increase turnover.
- Marketing Effectiveness: Successful marketing campaigns can create and stimulate demand, directly leading to higher sales and a faster inventory turnover.
- Sales Performance: The effectiveness of a company’s sales team and channels directly impacts how quickly inventory is sold. Weak sales performance, whether from in-store or online channels, will result in a low turnover ratio.
Technological Advancements Improve Inventory Turnover
Advanced inventory management technologies fundamentally transform how businesses improve inventory turnover through real-time tracking, automated analytics, and predictive forecasting capabilities.
- Inventory tracking systems:
To improve your inventory turnover, it is essential to integrate modern technologies such as barcode scanning, RFID technology, and IoT sensors to provide continuous visibility into stock levels, product movement patterns, and demand fluctuations across multiple locations. These technological solutions enable decision-makers to identify low inventory turnover scenarios before they impact profitability and cash flow. Research shows that businesses implementing comprehensive inventory tracking systems typically experience 20-30% improvements in turnover performance within the first operational year.
- Automated reordering systems:
This eliminates human errors and timing delays that often contribute to suboptimal inventory stock turnover rates.
- Predictive analytics:
Such capabilities within modern inventory systems enable proactive management of inventory turnover ratios. It uses machine learning algorithms that analyze historical sales patterns, seasonal trends, and market demand indicators. More advanced forecasting models can even incorporate external factors such as economic conditions, weather patterns, and regional events.
These analytical tools generate automated recommendations for optimal stock levels, reorder timing, and product mix adjustments that maximize turnover efficiency, preventing both overstocking and stockout scenarios.
Inventory Turnover Dashboard’s Essentials
We have mentioned the necessity of an inventory turnover dashboard before. So, what is needed in such a system to improve the efficiency of your inventory management? Let’s figure it out in this section.
Strategic Business Benefits
Implementing inventory turnover dashboards delivers measurable improvements in cash flow management by reducing capital tied up in excess stock. Businesses typically experience 15-25% improvements in working capital efficiency within the first year of dashboard implementation.
Cost management becomes more precise through real-time visibility into carrying costs, storage expenses, and obsolescence risks. This transparency enables proactive decision-making rather than reactive problem-solving.
Furthermore, those dashboards enhance forecasting accuracy by presenting historical patterns and trend analysis in easily digestible formats. This supports better procurement timing, optimal order quantities, and strategic inventory allocation across multiple locations.
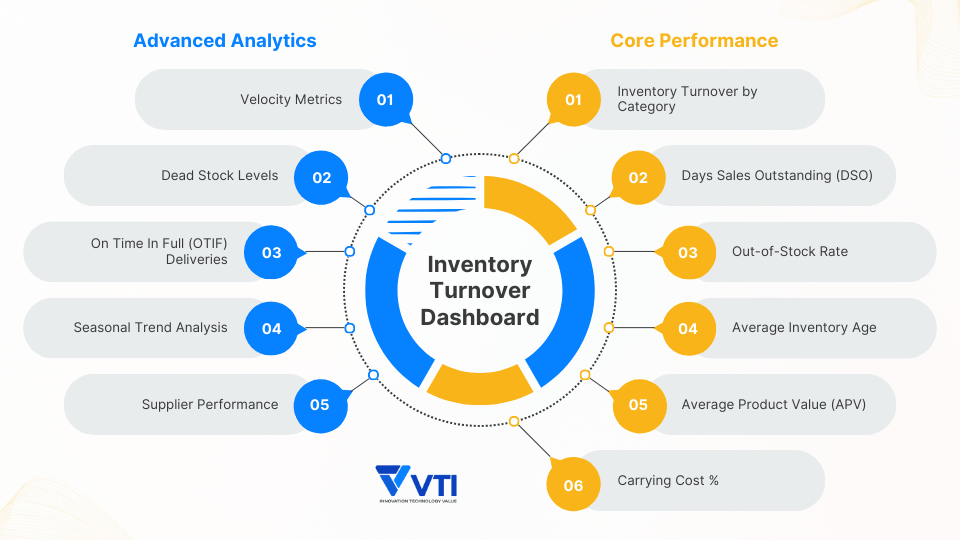
Essential Metrics to Track
Effective inventory dashboards consolidate key performance indicators (KPIs) into actionable insights, and here are the ones that should be included:
Core Performance Metrics:
- Inventory Turnover Ratios by Product Category – Measures how frequently specific product lines convert to sales, identifying high and low performers
- Days sales of inventory (DSI) – Calculates average days inventory remains unsold, indicating capital efficiency
- Out of Stock (OOS) Rates – Tracks the percentage of time products are unavailable, directly impacting customer satisfaction and revenue loss
- Average Inventory Age – Shows how long products sit in storage before sale, highlighting potential obsolescence risks
- Average Product Value (APV) – The mean value of each single inventory unit/product, helping prioritize high-value items and optimize capital allocation
- Average Order Value (AOV) – The mean dollar amount spent each time a customer places an order
- Carrying Cost Percentages – Measures the total cost of holding inventory as a percentage of the inventory value
Advanced Analytics Metrics:
- Velocity Metrics – Categorizes inventory into fast-moving, medium-moving, and slow-moving segments for strategic planning
- Dead Stock Levels – Identifies inventory with zero movement over specified periods, enabling proactive clearance strategies
- On Time In Full (OTIF) Deliveries – Measures supplier reliability by tracking the percentage of orders delivered complete and on schedule
- Seasonal Trend Analysis – Reveals cyclical demand patterns to optimize procurement timing
- Supplier Performance Indicators – Tracks lead times, order accuracy rates, and delivery reliability for supply chain optimization
With these metrics, your inventory turnover dashboard can provide the granular data necessary to identify optimization opportunities across your entire inventory ecosystem.
Final words
Mastering inventory turnover isn’t just about calculating ratios—it’s about transforming your entire approach to inventory management into a strategic advantage. The insights covered in this guide provide you with the tools to identify inefficiencies, benchmark against industry standards, and implement technology-driven solutions that optimize your cash flow and profitability. Remember, every day that inventory sits on your shelves is a day your capital isn’t working for you. By understanding the factors that influence turnover rates and leveraging modern inventory management systems, you can make data-driven decisions that directly impact your bottom line. The businesses thriving in today’s competitive Asian markets are those that view inventory not as a necessary burden, but as a carefully orchestrated asset that turns efficiently and consistently. Take time to evaluate your current turnover performance—the improvements you implement today will drive your operational success tomorrow.
At VTI, we specialize in building scalable IT infrastructure, seamless system integrations, and tailored retail solutions that transform distributed operational challenges into a structured, highly profitable ecosystem.