![[FREE EBOOK] Strategic Vietnam IT Outsourcing: Optimizing Cost and Workforce Efficiency](https://vti.com.vn/wp-content/uploads/2026/06/ebook-it-outsourcing.png)
Basket analysis is a method used to identify products that are frequently purchased together. By analyzing purchase data stored in POS systems and e-commerce purchase history, retailers can understand customer purchasing behavior. This insight can be applied to promoting cross-selling, optimizing store layouts, and improving the accuracy of recommendation engines.
This article provides a clear explanation of the basics of basket analysis, its practical applications, and key points to consider.
What is basket analysis?
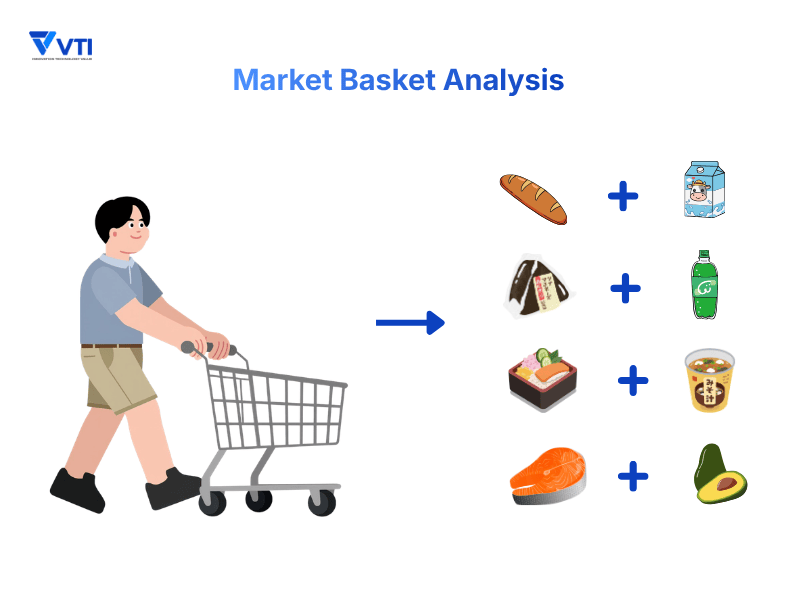
Market basket analysis is a data mining technique used to identify correlations between products by analyzing what items customers put into their shopping baskets together. By analyzing vast transaction data from POS or EC sites, it is possible to derive co-purchase rules.
For example, if customers who purchase product A also tend to purchase product B at the same time, these two products can be considered related.
By understanding these patterns in purchasing data, businesses can develop strategies based on actual customer behavior.
A well-known example is the “beer and diapers” case, where seemingly unrelated products were often purchased together, demonstrating how data analysis can reveal unexpected insights.
How basket analysis works
Basket analysis works by analyzing transaction data to identify relationships between products that are frequently purchased together.
In practice, this analysis is based on three key indicators: support, confidence, and lift. In many cases, these relationships are identified using algorithms such as the Apriori algorithm.
Three key metrics
Support
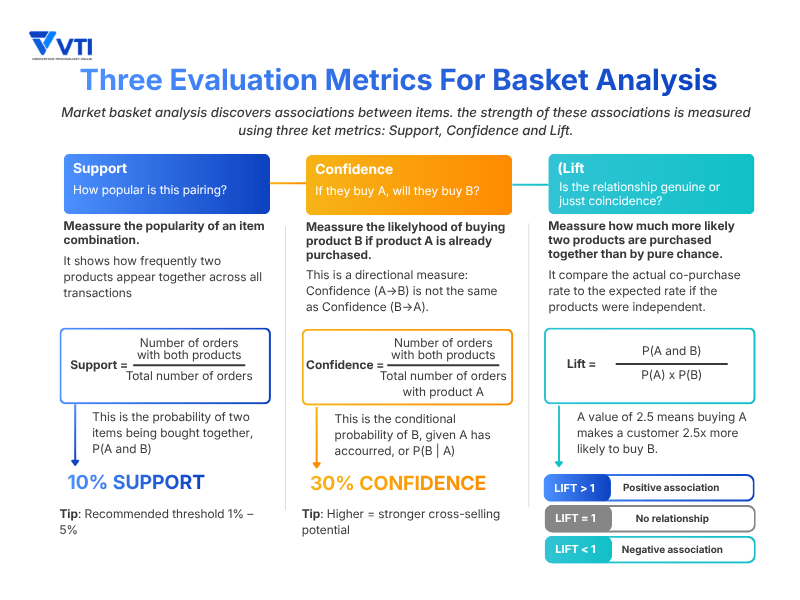
Support shows how often a combination of products appears across all transactions.
For example, if product A and product B are frequently purchased together, the support value will be higher. This helps identify commonly purchased product combinations.
| Support(A → B) = (Number of transactions including A and B) / (Total number of transactions) |
Confidence
Confidence indicates how likely product B is purchased when product A is purchased.
If many customers who buy product A also purchase product B, the confidence value becomes high. This metric is useful for identifying cross-selling (クロスセル) opportunities.
| Confidence(A → B) = (Number of transactions including A and B) / (Number of transactions including A) |
Lift
Lift measures the strength of the relationship between products.
| Lift(A → B) = Confidence(A → B) / (Probability of purchasing B) |
There are 3 scenarios:
- Lift > 1.0: Products are more likely to be purchased together (positive relationship)
- Lift = 1.0: No meaningful relationship
- Lift < 1.0: Products are less likely to be purchased together
This helps businesses identify meaningful product relationships that can be used in marketing and sales strategies.
Analysis algorithm: Apriori
To efficiently extract associations from massive POS Data, the Apriori algorithm is commonly utilized. The Apriori algorithm is designed to efficiently extract product combinations that appear frequently in transaction data. By excluding low-frequency combinations at an early stage, it becomes easier to find useful rules within large-scale purchase data.
Basic principle
It operates on the property that “if an itemset is infrequent, all of its supersets must also be infrequent.” By using this to “prune” unnecessary calculations early on, it significantly speeds up the processing of Big Data.
Practical point
For retailers handling a vast number of SKUs, implementing an AI-driven analysis system that properly utilizes this algorithm is directly linked to improving analysis accuracy.
How to perform basket analysis
Basket analysis generally follows three steps: data preparation, rule extraction, and applying the results. By following a simple process, basket analysis can be applied in practical business scenarios.
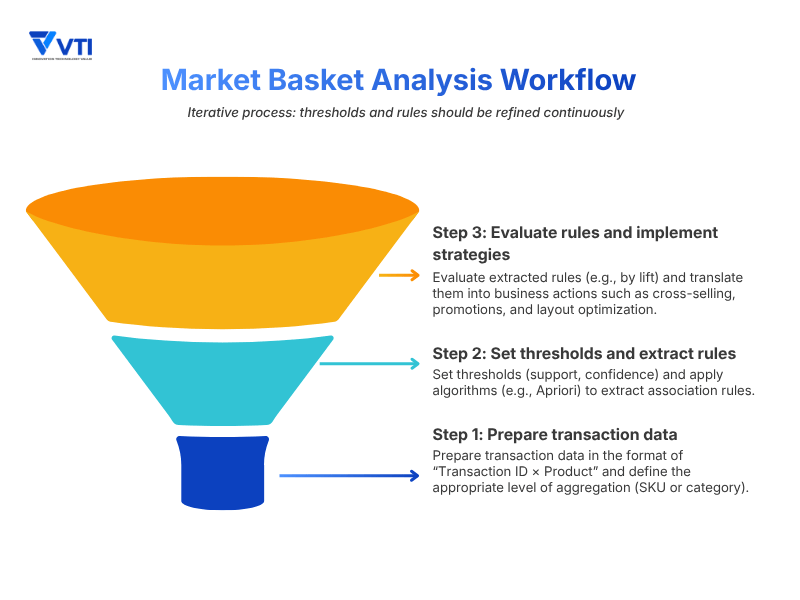
Step 1: Prepare transaction data
The first step is to prepare transaction data.
Basket analysis uses data in the format of “Transaction ID × Product”, where each transaction represents a single purchase. Key points when preparing data:
- Define aggregation level: Decide whether to analyze by SKU or product category. The SKU-level may be too granular to find significant rules, so aggregate data appropriately based on objectives.
- Data cleansing: Exclude returns and canceled transactions.
- Period setting: Set a suitable analysis period (e.g., 3 months to 1 year) to account for seasonal product biases.
Step 2: Set thresholds and extract rules
Next, set thresholds for support and confidence to extract product combinations.
- Tools: Python basket analysis or R’s arules package are commonly used.
- Adjustment tip: Start with lower thresholds and adjust based on the number of rules generated. Focus on rules with a Lift value of 1.0 or higher to capture meaningful patterns beyond mere chance.
Step 3: Evaluate rules and implement strategies
Finally, evaluate the extracted rules and translate them into business actions.
- Check for meaningful insights beyond obvious combinations
- Identify unexpected product relationships
- Evaluate whether the rule has a business impact
Effective rules can then be applied to cross-selling, store layout, or recommendation strategies.
Practical tips for success
The goal of basket analysis is not just data aggregation, but translating those insights into “concrete business actions” and maintaining consistency. To maximize effectiveness, keep these three points in mind:
- Establish a regular analysis cycle: Consumer behavior shifts constantly due to seasons and trends. Do not stop at a one-time analysis; review results regularly to keep your strategies fresh. Direct – Connection to business actions: It is crucial to immediately reflect identified co-purchase rules into the recommendation engine logic or shelf layout (display) changes.
- Maintain data freshness and integration: By keeping POS and EC data updated and maintaining a cross-channel analysis environment, you can achieve much higher predictive accuracy. A continuous cycle of analysis and improvement (PDCA) is what ultimately leads to significant revenue growth.
Usage scenarios of basket analysis
The co-purchase rules extracted from basket analysis are applied across various strategies, helping improve sales and enhance customer experience.
Cross-selling and upselling design
Association rules derived from basket analysis can be directly applied to cross-selling strategies. This serves as the foundation for the “people who bought this also bought…” feature on EC sites. By applying these rules to recommendation logic, businesses can:
- Provide relevant product suggestions
- Create bundle offers
- Optimize checkout recommendations
This helps increase average order value and improve conversion rates.
Shelf allocation and layout optimization
In physical stores, placing frequently purchased items close together enhances convenience and encourages impulse purchases. This provides the foundation for shelf allocation optimization and helps:
- Improve customer browsing experience
- Increase in-store engagement
- Maximize sales opportunities
Recommendation engine development
Basket analysis helps improve recommendation accuracy. By suggesting related products based on purchase history, businesses can provide more relevant recommendations to each customer. This enables:
- Generating recommendations based on purchase history
- Improving personalization
- Address the cold start problem (providing relevant suggestions to new users with little purchase history).
This contributes to higher engagement and conversion rates.
Promotion strategies
By leveraging co-purchase relationships, businesses can create bundle offers and discount campaigns that encourage customers to purchase multiple items together.
For example, promoting products that are frequently purchased together makes it easier for customers to understand the value of the offer and increases the likelihood of purchase.
Typical applications include:
- Bundle discounts for frequently co-purchased items
- Designing optimal product combinations for campaigns
- Selecting products for coupon distribution
- Planning promotions that encourage multi-item purchases
This approach shifts the focus from selling individual items to encouraging combined purchases, leading to higher average order value.
Additionally, because these strategies are data-driven, it becomes easier to measure effectiveness and continuously optimize campaigns.
Web behavior analysis
Beyond purchase data, basket analysis can also be applied to user behavior, such as page views and click patterns. For example:
- “Users who viewed this page also viewed…”
- Identifying navigation patterns
- Optimizing UI/UX and content placement
These insights help improve user journeys and overall website performance.
Key challenges and points to note in implementation
While the method itself is useful, there are several challenges when applying it in real business environments.
In many cases, analysis is performed, but the results are not effectively translated into business actions.
Identifying meaningful rules
One common issue is that the analysis often produces results that are technically correct but not particularly useful. For example, combinations such as “pasta and tomato sauce” or “bread and milk” are frequently identified.
These patterns are already well known and do not provide new insights for decision-making. To extract more valuable findings, it is important to focus on metrics such as lift, which help highlight relationships beyond obvious patterns.
Data volume and processing limitations
As the number of products and transactions increases, the number of possible combinations grows rapidly. This makes the analysis more complex and the results harder to interpret.
In practice, many organizations attempt to perform this analysis using spreadsheets such as Excel. However, this approach quickly reaches its limits when dealing with large datasets, both in terms of processing speed and accuracy.
Data fragmentation across channels
In many cases, data is stored across multiple systems like POS data, EC platforms, and customer databases.
When these data sources are not integrated, it becomes difficult to understand customer behavior across channels. As a result, the analysis may only reflect a partial view of reality.
Difficulty in applying insights
Even when useful patterns are identified, many companies struggle to translate them into concrete actions.
Typical challenges include:
- Too many rules with unclear priorities
- Difficulty linking results to business KPIs
- Lack of integration with marketing or operational processes
Without a clear execution path, the analysis often remains at the reporting level.
Continuous operation challenges
Customer behavior changes over time due to seasonality, campaigns, and external factors.
If the analysis is not updated regularly, insights quickly become outdated. However, maintaining continuous analysis requires time, resources, and proper systems, which can be difficult to manage manually.
The future of basket analysis with AI and data integration
Data utilization is evolving from the stage of analysis to the stage of directly linking it to sales. In the midst of these changes, the role of basket analysis is also changing significantly.
Increasing data volume and the role of AI
According to IDC, global data creation is expected to reach 175 zettabytes by 2025, with retail being a major contributor due to the expansion of EC and omni-channel initiatives.
As data volumes continue to grow, identifying meaningful patterns manually becomes increasingly difficult. In this context, AI-based analysis is being adopted to support more efficient and scalable basket analysis.
At the same time, a report by Salesforce indicates that over 70% of consumers expect personalized experiences, highlighting the growing importance of data-driven recommendations in retail.
Connecting basket analysis to revenue growth
The value of basket analysis increases significantly when it is integrated into broader data strategies. For example, McKinsey reports that companies effectively leveraging personalization can achieve 10–15% revenue uplift, particularly in retail and e-commerce environments.
In practice, this involves applying co-purchase patterns identified through basket analysis to:
- Recommendation systems
- Promotional campaigns
- Cross-channel customer experiences
Data integration and OMO
Another important trend is the integration of customer data across channels. By combining POS data, EC data, and customer attributes, businesses can build a more complete view of customer behavior.
This approach supports OMO (Online Merges with Offline) strategies, where insights from in-store and online behavior are used together to improve customer experience.
Faster Decision-Making through BI
The ability to act on data quickly is also becoming increasingly important. According to Deloitte, organizations with advanced analytics capabilities are more likely to make faster and more effective decisions compared to their peers.
By visualizing basket analysis results through BI tools, companies can:
- Quickly adjust store layouts
- Optimize promotions
- Support data-driven decision-making at the operational level
Conclusion
As customer behavior becomes more complex and data volumes continue to grow, the ability to extract meaningful insights and apply them effectively is becoming increasingly important. Companies that integrate basket analysis into their data strategy can move beyond reactive decision-making and take a more proactive approach to customer engagement and sales optimization.
At the same time, many organizations already possess large volumes of POS data but face challenges in turning that data into actionable outcomes. In such cases, reviewing how data is currently collected, integrated, and utilized can be an effective starting point.
VTI supports retail businesses in building practical data utilization environments, from integrating POS and e-commerce data to developing analytics platforms and applying AI-driven analysis for improving retail operations. Our services help organizations not only analyze data, but also connect insights to real business actions, including cross-selling strategies, promotions, and operational improvements.
If you are exploring ways to better utilize your data or enhance your retail performance through data-driven approaches, we would be happy to discuss your current situation.