![[FREE EBOOK] Strategic Vietnam IT Outsourcing: Optimizing Cost and Workforce Efficiency](https://vti.com.vn/wp-content/uploads/2026/06/ebook-it-outsourcing.png)
RFM analysis is a customer analysis method that evaluates purchasing behavior based on three dimensions: Recency, Frequency, and Monetary. In retail, where large volumes of transaction data are generated daily, segmenting customers using these metrics is a practical first step toward maximizing LTV (lifetime value). This article explains the fundamentals of RFM analysis, how to apply it using POS data, and how to implement it efficiently for large-scale data processing.
What is RFM Analysis?
RFM analysis groups customers by evaluating their purchasing behavior across three dimensions: how recently they purchased (Recency), how often they buy (Frequency), and how much they spend (Monetary). “R, F, and M” are derived from the first letters of these three indicators.
Customer segmentation using RFM helps identify high-potential customers and contributes to increased revenue and retention strategies (Sciencedirect). Hence, this method is widely used in retail and e-commerce to analyze purchasing behavior using transaction data such as POS systems and purchase history.
The Three Metrics of RFM
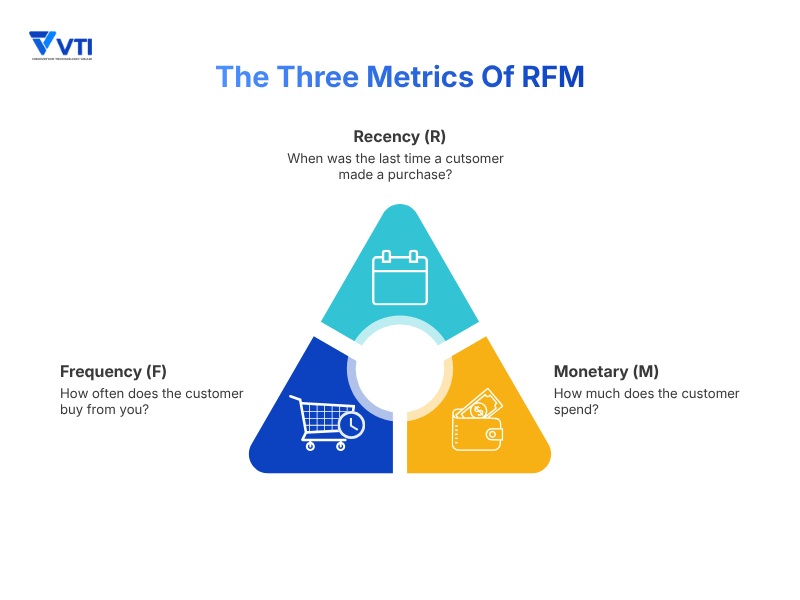
- Recency (R): Measures how long it has been since the customer’s last purchase. It follows the hypothesis: “the more recently a customer bought, the more likely they are to return.”
- Frequency (F): Reflects the number of purchases made by a customer over a predefined period. Higher frequency indicates strong brand loyalty and repeat purchasing behavior.
- Monetary (M): Measures the total amount a customer has spent. Customers with higher spending contribute more to LTV (Lifetime Value).
Interpreting Customer Status Through RFM
Relying on a single metric often leads to incomplete insights. By combining all three, clearer customer patterns emerge:
- Low R, High F/M: Previously high-value customers who show signs of churn. Win-back campaigns are often required.
- High R, Low F/M: New customers who recently joined. Strategies to encourage repeat purchases are effective here.
- High R, High F/M: Loyal customers who consistently support the business.
In practice, these values are often converted into scores (e.g., 1 to 5) rather than used as raw numbers. This approach allows businesses to standardize customer evaluation, compare customers more objectively, and enable efficient customer segmentation.
RFM Analysis vs Other Methods
While there are various customer analysis methods, RFM analysis is the most practical for the retail industry. Here is how it differs from the other two popular methods: Decile analysis and LTV.
| Method | Main Focus | Key Feature | Typical Use Case |
| RFM analysis | Customer behavior | Combines Recency, Frequency, Monetary | Customer segmentation and churn prevention |
| Decile analysis | Revenue distribution | Ranks customers by total spend | Understanding sales structure |
| LTV (Lifetime Value) | Long-term value | Estimates total future value | Strategic planning and budgeting |
RFM Analysis vs. Decile Analysis
Decile analysis ranks customers based on total spending, but it does not consider when purchases were made. For example, a customer who spent heavily in the past but has not purchased recently may still be ranked highly. In practice, this can lead to inefficient marketing efforts. RFM analysis addresses this limitation by incorporating Recency, allowing businesses to identify customers who are active right now and those who may be at risk of churn.
RFM Analysis and LTV
RFM analysis and LTV are not alternatives, but complementary concepts. They are best understood as the tool (RFM) and the goal (LTV).
- LTV (the goal): Maximize total customer value over their entire relationship with the brand.
- RFM (the means): Identifying customer status and enabling actions such as churn prevention and repeat purchase promotion.
By using RFM to detect early signs of churn and apply targeted actions, businesses can directly improve LTV.
When to Use Each Method
- Decile analysis: Use as a starting point to understand your overall revenue structure and identify who your top contributors are.
- RFM analysis: Use as your daily tactical tool for precise segmentation and immediate action (e.g., personalized coupons or re-engagement emails).
- LTV: Use as your ultimate North Star metric to evaluate long-term business health and guide strategic budgeting.
How to Perform RFM Analysis
RFM analysis is most effective when combined with hypothesis-driven analysis and actionable strategies. It should be used as a continuous cycle of analysis, action, and improvement.
Step 1: Define the Objective and Collect Data
Start by defining the business objective, such as improving repeat purchase rates or preventing customer churn. Then prepare transaction data from the following sources:
- POS systems
- ID-POS (customer ID-linked purchase data)
- E-commerce platforms
Required data includes: Customer ID, Purchase date, and Purchase amount. Data quality is critical. Remove noise such as returns, cancellations, or test data, and normalize inconsistent records to ensure reliable analysis.
Step 2: Define the Analysis Period
Set the time range based on business characteristics. For example, daily-use products benefit from shorter time windows, while high-value products require longer ones. The analysis period should reflect actual customer behavior patterns.
Step 3: Analyze Distribution and Set Thresholds
Before scoring, examine the distribution of R, F, and M values. For example, purchase amounts may cluster around specific price ranges, and frequency may vary significantly across customer groups. Using these insights, define thresholds that align with your business reality.
Step 4: Convert Metrics into Scores
Convert raw values into scores (e.g., 1 to 5) to standardize evaluation.
| Score | Recency | Frequency | Monetary |
| 5 | Within 7 days | 20+ times | High spend |
| 3 | Within 60 days | 10+ times | Medium spend |
| 1 | Over 1 year | Low frequency | Low spend |
Note: Thresholds should be adjusted depending on product characteristics. Avoid overly detailed segmentation, as it can make execution difficult.
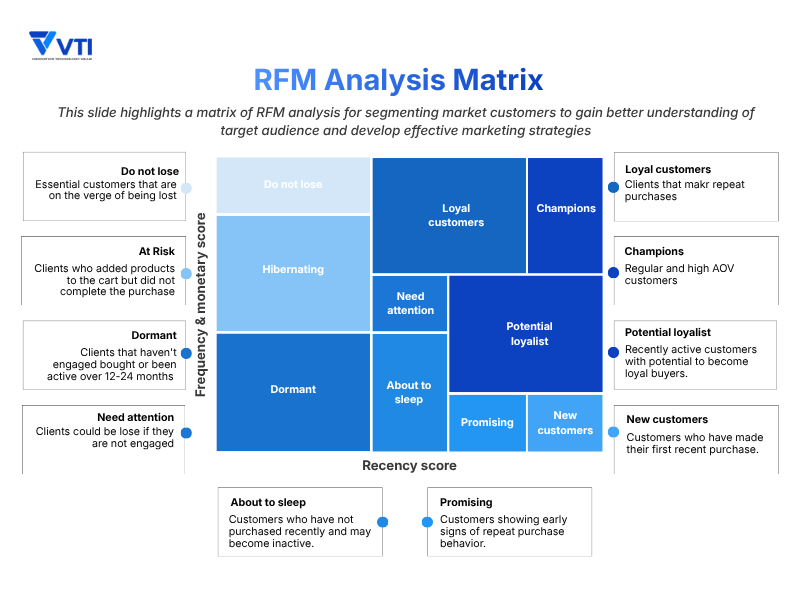
Step 5: Segment Customers and Implement Actions
Group customers based on their scores and define appropriate actions:
- High-value customers: Focus on loyalty programs and exclusive experiences.
- At-risk customers: Provide incentives or personalized recommendations to prevent churn.
- New customers: Encourage repeat purchases through follow-up campaigns.
- Dormant customers: Evaluate reactivation strategies based on ROI.
Prioritizing segments is important to allocate resources effectively. After implementation, continuously monitor results and refine strategies through the PDCA cycle.
Applying RFM Segments in Retail Operations
The real value of RFM analysis lies in using segment data as triggers to automate actions across retail systems. Instead of treating RFM as a static report, modern retail environments use it as a dynamic input for CRM, CDP platforms, and marketing automation. Behavioral segmentation approaches such as RFM have been shown to improve marketing efficiency and customer retention by 20-30% (Harvard Business Review).
Segment-Based Actions and System Integration
| Segment | Characteristics | System-Driven Action | Expected Outcome |
| High-value customers | High R, F, M scores | Trigger loyalty programs, exclusive offers, early access via CRM | Increased loyalty and repeat purchases |
| At-risk customers | High F/M but low R | Detect inactivity and automatically deliver personalized offers | Churn prevention |
| New customers | High R, low F/M | Trigger onboarding flows and follow-up campaigns | Increased purchase frequency |
| Dormant customers | Low R, F, M | Evaluate ROI and apply selective reactivation or exclusion | Optimized marketing cost |
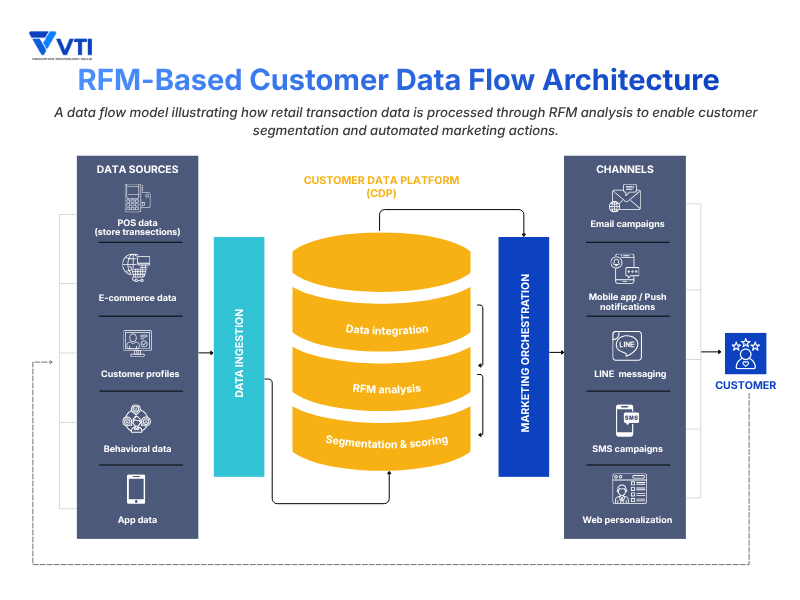
System Integration in Retail Tech
RFM analysis becomes most valuable when segment data is used as triggers to automate actions across retail systems. In modern retail systems, segmentation is not handled manually. Instead, RFM scores are continuously updated in CDP or CRM platforms, used as triggers for marketing automation, and connected to multiple channels such as mobile apps, LINE, and email. For example, when a customer’s Recency score drops below a threshold, an automated workflow can be triggered to send a personalized offer through the most effective channel.
Limitations of RFM Analysis and How to Address Them
While RFM is a powerful framework, it is not a silver bullet. To build a truly data-driven retail operation, you must understand its limitations and how to overcome them using modern technology.
Common Pitfalls of RFM Analysis
Incompatibility with Infrequent Purchases
For high-value or infrequently purchased products such as appliances or furniture, Frequency tends to remain low, making standard scoring less effective.
Limited Context of Customer Behavior
RFM metrics focus on transaction data and do not capture the reasons behind purchases or changes in customer needs, such as life events or preferences.
Misclassification of Promotion-Driven Customers
Customers who purchase only during large promotions may be classified as high-value due to high spending, even though their long-term loyalty is limited.
How to Enhance RFM Analysis
RFM analysis is most effective when used as part of a broader data strategy, combining multiple methods and technologies to better understand and predict customer behavior.
Combine with Additional Analysis Methods
RFM can be complemented by other approaches to provide deeper insights:
- CTB analysis (category, taste, brand): Helps identify customer preferences and product affinity.
- Segmentation analysis: Incorporates demographic and behavioral attributes.
Using RFM to identify who to target and CTB or segmentation to determine what to offer enables more effective strategies.
Customize Scoring Thresholds
Scoring rules should be adjusted based on product characteristics and purchase cycles. For example, daily-use products suit shorter time windows, while durable goods require longer ones.
Leverage AI for Predictive Insights
RFM segmentation enables businesses to identify high-value customers and potential churn risks, supporting more effective retention strategies (IBM). It focuses on past behavior, but it can be extended using AI and machine learning to improve store performance by predicting churn probability and estimating next purchase timing. This enables proactive actions before customers become inactive.
Scaling RFM Analysis: Building a Data Infrastructure
To transform RFM analysis from a one-time report into a continuous driver of business growth, it must be integrated into a scalable data infrastructure. As data volume and operational complexity increase, manual analysis becomes insufficient, requiring a more structured and automated approach.
Data Processing with SQL and Data Warehousing
When transaction volumes grow, spreadsheet-based analysis becomes difficult to maintain. At this stage, organizations typically adopt data warehouses such as BigQuery, Snowflake, or AWS Redshift. Key considerations include:
- Centralizing transaction data across POS and e-commerce.
- Handling returns, cancellations, and loyalty programs.
- Defining consistent business logic for RFM calculation.
By implementing these processes in SQL-based pipelines, companies can establish a single source of truth across teams.
Visualization and Decision-Making with BI Tools
To make RFM analysis actionable, results must be accessible to business users. BI tools such as Tableau, Looker, or Power BI are used to visualize customer segments, monitor changes in RFM scores, and enable drill-down into specific customer groups. For example, selecting an at-risk segment can generate a list of customer IDs for targeted action. This allows teams to move from static reporting to dynamic, data-driven decision-making.
Closing the Loop with CRM, CDP, and Automation
The most advanced stage is integrating RFM analysis with execution systems. In this architecture:
- RFM scores are continuously updated in CDP or CRM platforms
- Score changes act as triggers for automated workflows, and
- Actions are delivered across multiple channels such as mobile apps, LINE, and email.
For example, when a customer’s Recency score decreases, an automated workflow can trigger a personalized offer to re-engage them.
Case Study: How Starbucks Applies RFM at Scale
RFM-based customer segmentation is widely used in global retail operations. One well-known example is Starbucks, which leverages its digital ecosystem to translate customer data into actionable engagement strategies.
Starbucks uses transaction data from its mobile app and loyalty program to continuously analyze customer behavior. By incorporating Recency, Frequency, and Monetary patterns, it builds a responsive and data-driven customer engagement model.
- Behavioral triggers: Customers who visit frequently but show a decline in recent activity automatically receive targeted promotions or personalized offers to encourage return visits.
- Exclusive rewards: Highly engaged customers are offered exclusive rewards and early access to new products, strengthening long-term loyalty.
These actions are driven by integrated systems that combine CRM, mobile app data, and marketing automation. This approach reflects the core principles of RFM analysis, where customer behavior is translated into actionable segments and system-driven engagement. By continuously updating customer segments and triggering personalized interactions, Starbucks improves customer retention and repeat purchases at scale.
Conclusion
As customer behavior becomes more complex, retail businesses are shifting from broad, uniform approaches to more personalized and data-driven strategies. RFM analysis provides a practical framework for identifying customer behavior patterns and prioritizing actions. However, its effectiveness depends not only on the analysis itself, but also on how it is integrated into daily operations and system environments.
While many organizations already possess large volumes of POS and transaction data, challenges often arise in connecting this data to actionable outcomes. Building a structured data environment is becoming increasingly important.
VTI supports retail businesses in designing and implementing such data environments. Our services help integrate data sources to enable scalable analysis and system-driven operations.
If you are exploring how to better utilize your customer data or improve retail performance through data-driven approaches, we would be happy to discuss your current situation.