![[FREE EBOOK] Strategic Vietnam IT Outsourcing: Optimizing Cost and Workforce Efficiency](https://vti.com.vn/wp-content/uploads/2026/06/ebook-it-outsourcing.png)
Understanding what a planogram is and how to implement it effectively has become increasingly important for retail headquarters and merchandisers aiming to improve shelf productivity. This is particularly true in supermarkets, convenience stores, and drugstores, where limited shelf space directly impacts sales performance.
While traditional methods focused mainly on shelf arrangement, modern planograms have evolved into a data-driven operational framework connected to category management, POS analytics, and store operations. As retail environments become more complex, many retailers are shifting from conventional shelf allocation toward planogram-based operations as part of broader Retail DX initiatives.
This article explains the core concepts of planograms, how they differ from Tanawari methods, and why they are becoming a foundational part of modern retail operations.
Planogram definition, core concepts and differences from traditional shelf allocation
What is a planogram?
A planogram is a shelf planning method used to determine where products should be placed, how much shelf space each SKU should receive, and how categories should be organized within a store.
Unlike simple shelf layouts, modern planograms are built around sales data, category performance, and merchandising strategy. Their purpose is not only to organize products visually, but also to improve space productivity and create a more consistent store operation across multiple locations.
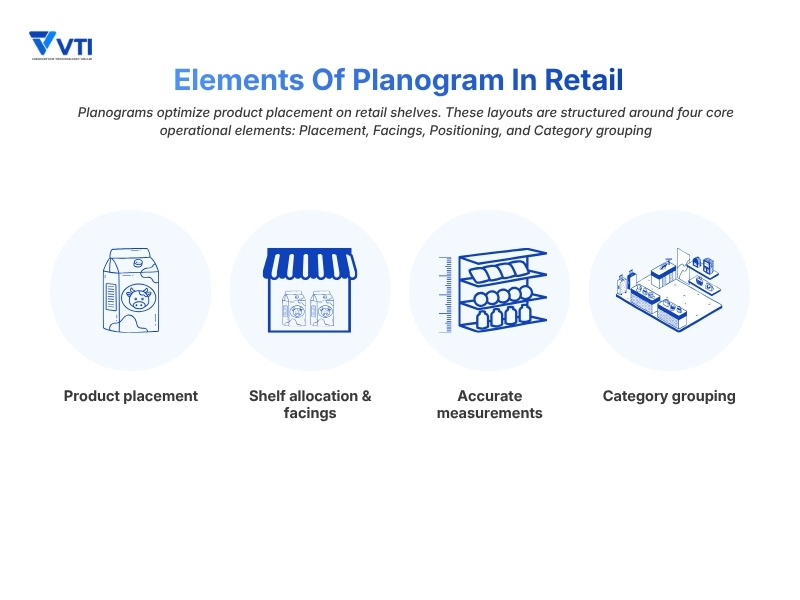
A typical planogram defines several key elements:
– Product placement: Where each SKU should appear on the shelf
– Facings: The number of visible units allocated to a product
– Shelf positioning: Placement based on visibility and sales priority
– Category grouping: Organizing related products to support navigation and cross-merchandising
Because physical shelf space is limited, retailers must constantly decide which products deserve greater visibility and which categories should receive larger allocations. Planograms provide a structured way to make those decisions using sales data and category performance rather than intuition alone.
Common types of planograms
Planograms are not one-size-fits-all blueprints. Depending on financial goals, supplier agreements, and inventory metrics, merchandisers utilize different planogram models to optimize shelf performance. The most common strategies include:
Strategy-based Planograms
– Market share-based: Allocates space proportionally to a product’s market share. Industry leaders receive premium, high-capacity placement to secure steady turnover and meet baseline customer demand.
– Profitability-based: Prioritizes gross margin over sales volume. High-margin items, proprietary brands, or private labels occupy prime shelf areas to maximize net profitability per square meter.
– Commercial status-based: Leverages brand equity. Well-known, heavily advertised brands serve as visual anchors to draw foot traffic into the aisle and validate the store’s assortment authority.
Layout-based planograms
– Horizontal placement: Displays products side-by-side along a single shelf level. Effective at eye level to encourage quick price comparisons and drive impulse purchases.
– Vertical placement: Stacks items vertically across multiple shelves in a column. Allows shoppers to scan an entire brand line or sub-category up and down without walking the whole aisle.
– Block arrangement: Groups products into solid visual blocks by brand or sub-category. This reduces visual clutter and simplifies store navigation for the customer.
Difference between traditional shelf allocation and planograms
In practice, the terms “Tanawari” and “planogram” are often used interchangeably. However, there is an important operational difference between the two.
Traditional shelf allocation mainly focuses on assigning products to available shelf space, often based on store experience, historical layouts, or physical constraints. Planograms take a more structured approach by using sales data, category performance, and merchandising priorities to optimize how retail space is used.
| Feature | Tanawari | Modern planogram |
| Primary driver | Store experience or available shelf space | POS data, category management, and sales analysis |
| Granularity | General category placement | Exact facings, positioning, and shelf allocation |
| System integration | Manual spreadsheets or simple layouts | Integrated with POS and retail management systems |
| Operational purpose | Organizing products | Improving shelf productivity and store consistency |
To manage planograms more efficiently across multiple stores, many retail chains now use specialized shelf allocation systems connected to POS data, inventory management, and category planning.
These centralized systems help retailers maintain more consistent shelf layouts while improving visibility into actual store execution.
Why planograms are important in retail
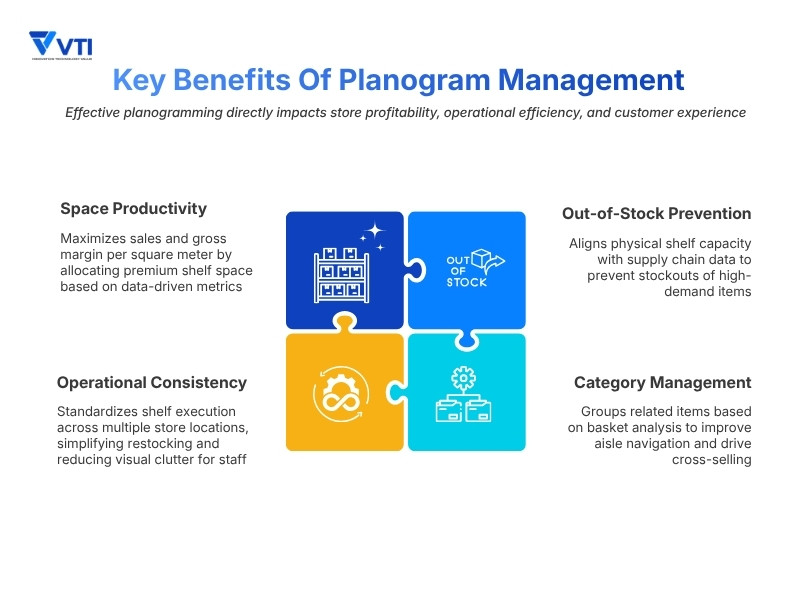
Maximizing sales and space productivity
Product placement has a direct impact on sales performance and overall space productivity. Planograms help retailers allocate shelf space based on sales data, category performance, and merchandising priorities. High-performing products are typically placed in areas with stronger visibility, while slower-moving products may receive fewer facings or less prominent shelf positions to reduce wasted shelf space.
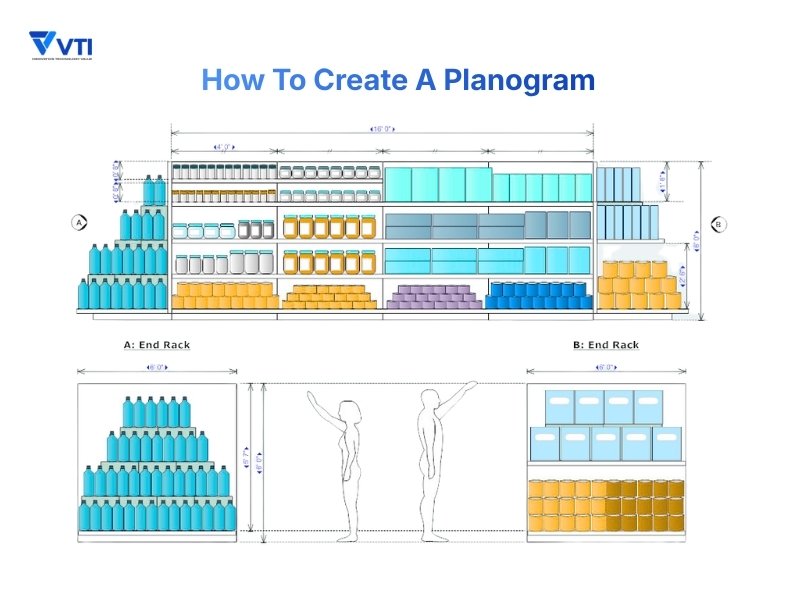
A key focus of this optimization is the “golden line” – the shelf area around customer eye level, typically between 85 cm and 140 cm from the floor. Retailers often use this high-visibility zone for strategic products, high-margin items, or private labels to maximize customer exposure.
Supporting category management
Modern planograms organize shelves based on shopper behavior and product relationships rather than treating products individually. Related items are grouped together to improve navigation and support cross-merchandising.
For example, in supermarket shelf allocation, products such as pasta, pasta sauces, and grated cheese are often positioned within the same visual area to encourage additional purchases. Many retailers also use basket analysis to identify which products are frequently purchased together and adjust shelf layouts accordingly.
Improving operational standardization across stores
Maintaining consistent shelf layouts across multiple stores is one of the biggest operational challenges in retail management. Even when headquarters creates standardized layouts, actual shelf conditions often change due to staffing differences, replenishment timing, local demand, and day-to-day operational adjustments at the store level.
Planograms help reduce these operational gaps by providing a shared framework for product placement, facings, and shelf organization across the retail chain. This also helps reduce dependency on individual store experience and makes shelf maintenance easier to manage across different store locations.
Reducing out-of-stock risk and opportunity loss
Planograms also play an important role in inventory visibility and replenishment efficiency.
When a fast-moving product receives too little shelf space, shelves can empty quickly during peak shopping hours, leading to immediate opportunity loss. On the other hand, allocating too many facings to slower-moving products reduces shelf productivity and increases unnecessary inventory pressure.
By aligning shelf allocation with POS data and replenishment cycles, retailers can maintain more balanced inventory exposure while reducing stockout risk and improving overall shelf efficiency.
How to create a planogram
Step 1: Analyze sales and POS data
Creating an effective planogram always begins with data rather than shelf design. Before defining product placement, retailers first need to understand which products are driving category performance and which products are occupying shelf space inefficiently.
Most retailers begin this process using POS data, SKU analysis, and ABC analysis to classify products based on sales contribution and inventory movement:
– Class A items: High-performing products with strong sales velocity that require stronger visibility and sufficient facings
– Class B items: Stable mid-performing products that require balanced shelf allocation
– Class C items: Lower-performing products. Some items may still be kept to maintain product variety within the category, while others may require reduced facings or removal from the shelf.
Some retailers also combine this analysis with RFM analysis to better align shelf allocation with customer purchasing behavior and high-value customer segments.
Step 2: Design categories and shelf rules
Once product performance is clear, merchandisers establish the category structure and shelf layout rules.
Customer flow analysis is often used during this stage, particularly in convenience store shelf arrangement and supermarkets where shopper movement directly affects visibility and impulse purchases.
To improve navigation and category visibility, retailers commonly use two merchandising approaches:
– Applying vertical rules: Merchandisers often lock related items or brands into top-to-bottom columns, allowing customers to scan and compare variations easily within a single visual zone.
– Applying Horizontal Rules: Products are mapped from left to right based on specific criteria such as price range, package size, or sub-category flow to guide the shopper’s journey down the aisle.
This stage effectively finalizes how blocks are grouped, which high-margin items secure the eye-level slots, and how total facings are allocated across the physical fixture before any digital drawing begins.
Step 3: Utilize planogram software and tools
After shelf rules are finalized, the actual planogram layout is created.
Many retailers now manage layouts through specialized shelf allocation systems connected to POS and inventory management tools. These systems allow headquarters to manage facings, category allocation, and shelf positioning more consistently across multiple stores.
Some smaller retailers still rely on spreadsheets or manual templates, but larger retail chains increasingly use centralized systems to improve operational control and reduce manual adjustment work.
Step 4: Share plans with stores and implement layouts
A planogram only works if it can be executed consistently at the store level.
Once the layout is finalized, headquarters distributes the planogram to individual stores for implementation. In practice, this stage is often more difficult than the planning process itself because actual store conditions vary depending on staffing, replenishment timing, local demand, and physical shelf structure.
For this reason, many retailers use visual operational guidelines to simplify shelf maintenance and seasonal shelf resets, particularly in stores where daily operations rely heavily on part-time staff.
Clear communication between headquarters and stores is also important so that layout adjustments can be managed consistently across locations rather than handled independently by each store.
Step 5: Conduct performance evaluation and continuous improvements
Planograms are not fixed layouts. Product performance, customer behavior, and seasonal demand continue changing throughout the year.
After implementation, retailers regularly review sales data, stockout frequency, category performance, and shelf productivity to evaluate whether the layout is working as expected.
In many retail environments, planograms are updated continuously through a PDCA cycle based on ongoing sales analysis, basket analysis, and operational feedback from stores.
Modern technology in planogram management
Once a planogram is deployed, the next challenge is maintaining it accurately on the sales floor. Traditional planogram management often struggles with the gap between headquarters planning and actual store execution. This is why manual shelf checks are becoming harder to rely on, especially for retail chains managing multiple stores with different staffing conditions and replenishment timing.
As retail operations become more complex, many retailers are shifting away from manual shelf audits toward more automated and data-driven approaches.
Smart shelf and image recognition technology
One of the biggest changes in recent years has been the adoption of image recognition technology and Smart Shelf systems. Instead of relying entirely on manual shelf checks, some retailers now use AI-based monitoring systems to track product placement and shelf conditions on the sales floor.
These systems compare actual shelf layouts against digital planograms and automatically detect issues such as misplaced products, missing facings, or out-of-stock items. When deviations are identified, alerts can be sent directly to store staff, allowing stores to respond more quickly without relying on routine manual inspections.
This approach helps retailers improve planogram compliance while reducing the operational workload required for daily shelf maintenance.
Integrating AI with retail data analytics
Modern planogram systems are also becoming more closely connected to retail data analytics.
Rather than relying only on historical POS data, some retailers now combine planogram management with customer flow analysis, inventory data, seasonal demand patterns, and real-time sales performance to adjust shelf allocation more dynamically.
For example, retailers may increase facings for fast-moving products during seasonal campaigns or adjust category positioning based on changes in customer traffic patterns within specific store areas.
As these systems become more data-driven, planogram management is gradually shifting from a static operational task to a continuously optimized retail process.
Why planograms are becoming a foundation of retail DX
Many retailers are discovering that retail DX initiatives become difficult to scale when shelf operations still depend heavily on manual adjustments and store-level intuition.
Attempting to deploy advanced store analytics on top of unstandardized shelf layouts often creates operational gaps between headquarters planning and actual store execution.
By standardizing shelf management through planogram-based operations, retailers can connect physical shelf layouts more effectively with POS analytics, inventory systems, AI monitoring, and centralized reporting tools.
For this reason, planograms are increasingly becoming part of the operational foundation for modern retail DX environments.
Best practices for successful planogram implementation
Base layouts on accurate and updated data
An effective planogram should reflect actual store conditions rather than static assumptions.
Retailers should regularly update sales analysis using current POS data and inventory information before adjusting shelf layouts. Relying on outdated sales patterns or generic templates can easily lead to stockouts for fast-moving items while slower products continue occupying valuable shelf space inefficiently.
Maintain clear communication between headquarters and stores
One of the most common reasons planograms fail is the disconnect between headquarters planning and actual store operations.
Layout guidelines should be visual, straightforward, and easy for store staff to follow during daily replenishment work. Retailers should also maintain clear feedback processes so stores can report local demand changes or shelf constraints instead of making untracked adjustments independently.
Simplify daily store operations
In many retail environments, daily shelf maintenance and seasonal shelf resets are often handled by part-time staff.
If a planogram is too complicated to maintain during daily operations, compliance naturally declines over time. Many retailers therefore use standardized shelf markers, color-coded sections, or digital operational guides to simplify execution and reduce dependency on individual store experience.
Maintain a continuous PDCA cycle
Planograms should be managed as an ongoing operational process rather than a one-time project.
Retailers regularly review sales performance, stockout frequency, basket size, and shelf productivity to evaluate whether layouts are functioning effectively. Based on these results, planograms are continuously adjusted through a PDCA cycle to reflect changing customer behavior, seasonal demand, and operational conditions.
Conclusion
Transitioning from Tanawari to data-driven planograms is becoming a baseline requirement for retailers aiming to optimize space productivity. Standardizing physical shelves creates the essential digital benchmark needed to support modern automated tools and eliminate store-level intuition.
At VTI, we help retailers build more data-driven store operations through technologies such as customer flow analysis, AI-based monitoring, and centralized retail management systems. Contact us to explore retail AI DX solutions tailored to your retail operations.