





![[FREE EBOOK] Strategic Vietnam IT Outsourcing: Optimizing Cost and Workforce Efficiency](https://vti.com.vn/wp-content/uploads/2026/06/ebook-it-outsourcing.png)



Retail data utilization is becoming a key priority for retailers seeking to improve their entire operations. By combining and analyzing data from multiple sources, retailers can better understand customer behavior, optimize store operations, improve demand forecasting, and build a stronger foundation for retail DX initiatives.
Japan’s retail environment makes this urgent. The domestic BtoC e-commerce market has reached ¥26.1 trillion (METI), retail bankruptcies are rising, and labor shortages show no sign of easing. The retailers pulling ahead are not necessarily the ones with the biggest budgets or the most sophisticated technology. They are the ones who have figured out how to turn the customer data and transaction history they already have into decisions that stick.
This article explains the key types of retail data, how leading retailers use data in practice, common analytical methods, and best practices for building a data-driven retail organization.
Why retail data utilization matters more than ever
Adapting to changing consumer behavior
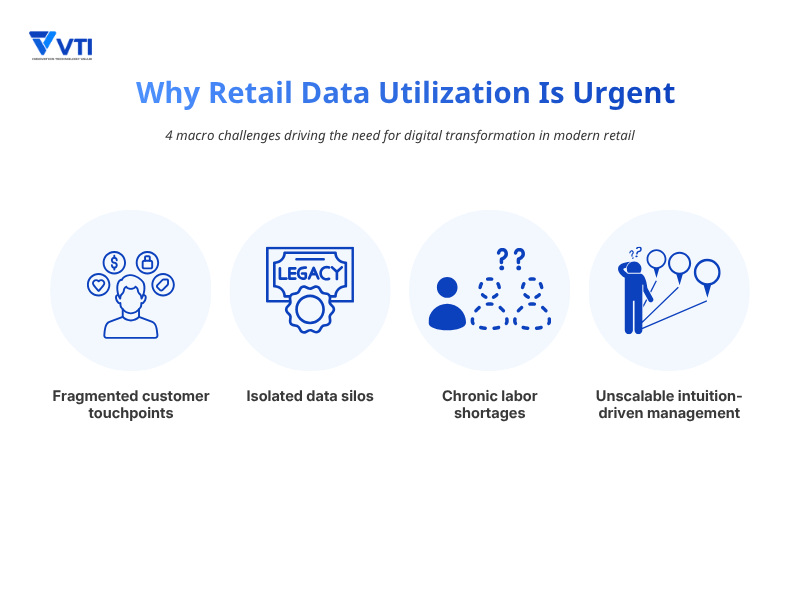
Consumer purchasing behavior has become increasingly difficult to predict. They do not buy products in a straight line anymore; they mix online and offline channels easily. They might find a product on social media, read reviews on a website, test the item in a physical store, and finally buy it online.
If a retailer only looks at total sales from the cash register, they only see the final step. POS data cannot tell you why customers left the store without buying. To understand what customers really want, retailers need to connect consumer purchase data from all channels.
Addressing labor shortages through smarter operations
The labor shortage in Japan’s retail sector is severe. Data from the Ministry of Health, Labour and Welfare (MHLW) shows that more employees are leaving the retail industry than joining it. Additionally, research by Teikoku Databank states that business failures caused by labor shortages have reached record highs, and the retail sector is hit the hardest.
Retailers cannot solve this problem just by hiring more people because the working population is shrinking. The real question is: “How do we make our current staff more productive?” Data is the answer. By analyzing store traffic and sales speed, retailers can automate simple tasks and place human staff where they are needed most to help customers.
The limitations of experience-based decision making
For a long time, Japanese retail success relied on the personal experience and intuition of veteran store managers. A good manager knows which products sell well together and when the store gets busy.
However, this personal knowledge has two big flaws: it cannot scale to other stores, and it disappears when the manager leaves. When an experienced employee retires, the store loses that knowledge. Data utilization does not replace human experience; it supports it. By combining data with real-world experience, retailers can create a standard framework for success across hundreds of locations.
Data utilization as the foundation of retail DX
According to digital transformation reports from the METI, about 74% of large companies in Japan use legacy IT systems that are over 20 years old. This causes data siloing. The marketing team manages the app data, store managers look at POS data, and the logistics team handles warehouse data.
Because these systems cannot talk to each other, making business decisions becomes very slow. Buying new tools like digital signs or mobile apps without connecting the underlying customer data utilization strategy will only add costs without bringing real value.
The retail data ecosystem: types of data and their value
To build a good data strategy, retailers need to look at all types of data available across their operations.
| Data type | Primary source | Business value |
| POS data | Cash registers, self-checkout systems | Understand what sold, when it sold, and how products perform over time |
| Customer data | Loyalty programs, membership apps, CRM systems | Understand who customers are and how to strengthen long-term relationships |
| Purchase data | Transaction histories, basket data | Identify buying patterns and product affinities |
| Inventory data | ERP systems, warehouse management systems | Improve stock visibility and prevent stockouts or overstocking |
| EC and online data | Online stores, website analytics | Understand digital customer journeys and purchase intent |
| In-store behavioral data | AI cameras, traffic counters, heatmaps | Visualize how shoppers move and interact within physical stores |
| External data | Weather reports, event calendars | Predict sudden changes in demand due to weather or local events |
Practical data analysis methods for retailers
Collecting data alone does not improve business performance. The real value lies in advanced customer data analysis that turns information into clear, day-to-day actions on the store floor.
ABC analysis: prioritizing your inventory
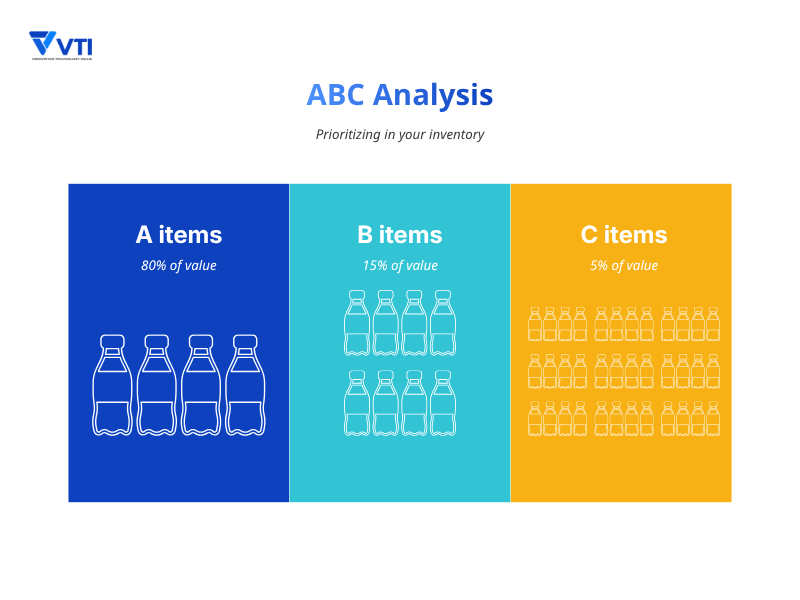
ABC analysis divides your products into three groups based on how much sales revenue they bring:
– A-items (top ~20% of products): Generate 70-80% of total revenue. These items need strict inventory control and daily tracking so you never run out of stock.
– B-items (next ~30% of products): Moderate contributors that can use automated reordering.
– C-items (bottom ~50% of products): Low-impact items that bring very little revenue. You can reduce these items to save shelf space.
RFM analysis: core customer data analysis method
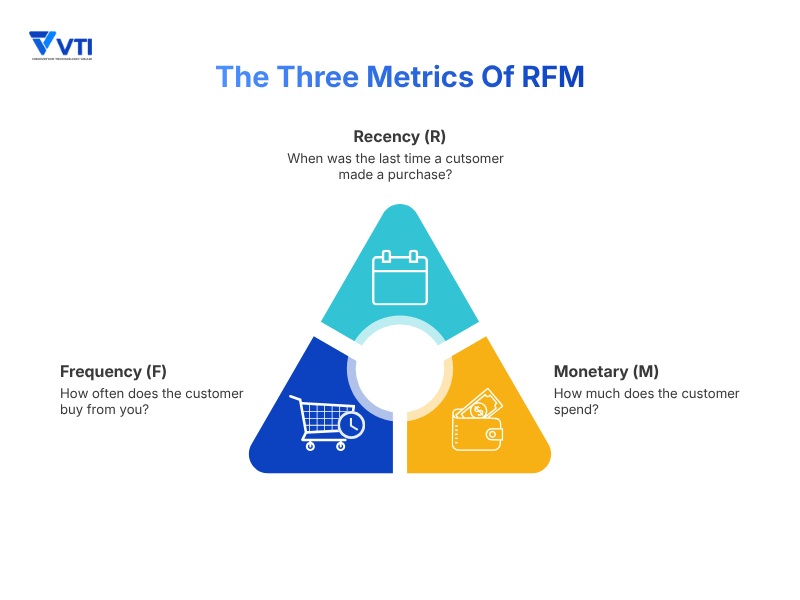
RFM is a popular framework for customer data analysis. It scores customers using three simple metrics: Recency (how recently they bought something), Frequency (how often they shop), and Monetary value (how much money they spend).
Instead of sending cheap coupons to everyone, marketing teams can use RFM to find “VIP Customers” to reward them, or “At-Risk Customers” (who used to shop often but haven’t returned lately) to send them special invitations to return.
Market basket analysis: finding product connections
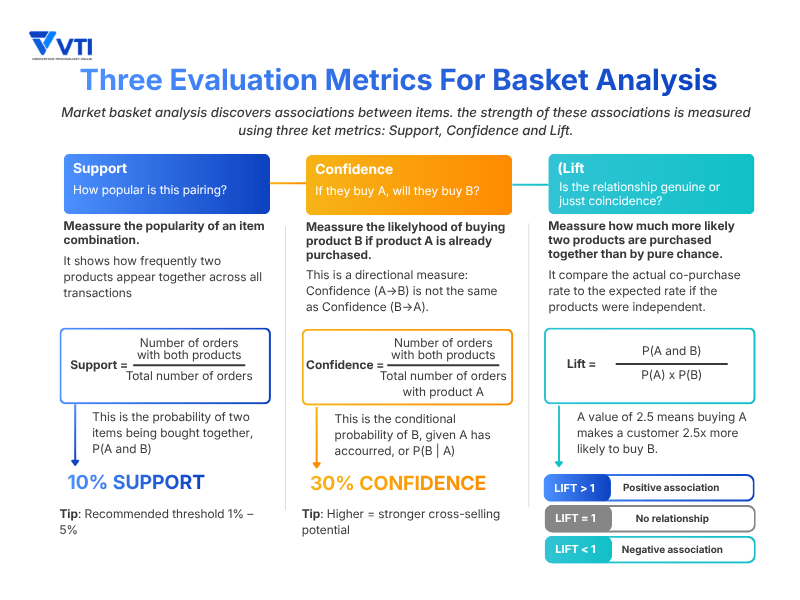
This method looks at which products are frequently bought together in the same transaction. For example, market basket analysis helps you discover that customers who buy Item A are highly likely to buy Item B. Retailers use these insights to place connected products next to each other on shelves, create bundle promotions, or build online recommendation tools.
Test vs. control stores: measuring real success
To see if a new store layout or a marketing campaign actually works, advanced retailers do not just compare “before and after” sales. External factors like a sudden hot day can change sales numbers.
Instead, they compare a group of Test Stores (where they apply the change) against a group of Control Stores (which keep the normal setup). By subtracting the sales changes of the Control Stores from the sales changes of the Test Stores, retailers can find the true, unvarnished sales lift of their campaign.
Case studies: how top Japanese brands use data
The most successful retailers in Japan connect data directly to daily actions on the store floor.
Lawson: AI-powered automated ordering
Convenience stores sell many fresh foods with short expiration dates. Lawson built an AI ordering system that connects historical POS data with weather forecasts, local school events, and holiday calendars. The system automatically calculates the best order amount for each product daily. This helped Lawson reduce food waste and prevent empty shelves, without making extra work for store staff.
MUJI: Improving products with customer insights
MUJI uses its mobile app to collect both shopping history and direct customer feedback. Their data teams analyze customer complaints and reviews to find issues with current products. This data goes directly to the manufacturing teams, allowing MUJI to redesign products based on real customer usage rather than executive guesswork.
DyDo Drinco: Breaking old merchandising myths
For a long time, retailers believed in the “Z-Layout” myth—the idea that customers always scan product displays from top-left to bottom-right. DyDo Drinco tested this by using eye-tracking technology and behavioral data on their vending machines.
The data proved the myth wrong: customers’ eyes skip around based on product colors and logos. Based on this insight, DyDo Drinco moved their main drink line to the bottom row, which was previously thought to be the worst spot, resulting in a measurable sales increase.
Yakult: Combining internal and external data
Yakult proved that sales history becomes much more powerful when combined with outside data. They integrated their sales logs with regional weather data and Google search trends. This allowed them to predict exactly when demand for certain health drinks would spike in specific areas, allowing their logistics and production teams to prepare stock in advance.
6-step roadmap for retail data utilization
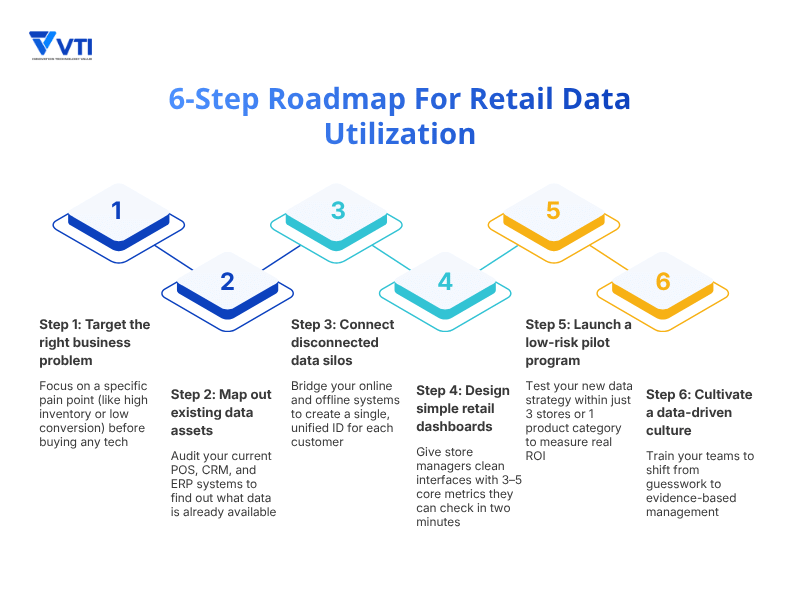
Step 1. Define the business problem first
Do not start by asking “What data do we have?” or “Which AI tool should we buy?” Start with a clear problem: How do we reduce extra stock in our winter clothing line? or Why are conversion rates low at our Shibuya store? The business problem tells you exactly what data you need to collect.
Step 2. Audit your current data assets
Check your existing IT systems (POS, CRM, ERP). Find out what data you already have, where it is stored, and if the data is clean. Most retailers realize they already have the data they need. It is just trapped in separate systems.
Step 3. Break down data silos
Connect your different systems using cloud storage or data platforms without replacing your existing IT tools. The most important goal here is to create a Unified Customer ID so you know your online app user and your in-store shopper are the same person.
Step 4. Build action-oriented dashboards
Data is only useful if your staff can understand it. Create simple, clean dashboards for store managers that show 3 to 5 clear metrics they can check in two minutes: Which items might run out of stock tomorrow? or Which shelf display has low customer focus today?
Step 5. Start with a small pilot program
Do not change your entire company overnight. Select one product category or a small group of 3 stores to test your new data strategy. Measure the results carefully for 30 to 60 days against normal stores to prove the financial value before expanding.
Step 6. Build a data-driven culture
Technology only works if people use it. Provide simple training for store managers and corporate teams so they get used to checking data before making big decisions. This shifts your company from guesswork to evidence-based management.
Overcoming common challenges in retail data projects
Fixing data quality and talent shortages
Analytics tools will give wrong results if the underlying data is incorrect. Common issues include duplicate customer accounts or wrong product codes. Retailers must check data quality regularly.
Also, finding data analytics experts who understand the retail business in Japan is difficult. Expecting store staff to learn advanced data science is not practical. The best solution is to partner with an experienced external IT company to handle the complex data engineering, while training your internal team on basic data usage.
Turning insights into real actions on the store floor
The biggest failure in data projects is when corporate analysts find great insights, but nothing changes at the physical store. If a report is too complicated, store managers will ignore it. Keeping dashboards simple, setting up automatic alerts, and creating clear action steps are just as important as the technology itself.
Conclusion
Retail data utilization is not just an IT project. It is a project to make better business choices. The most successful retailers in Japan are not those with the most expensive tools. They are the ones who pick a real problem, connect the right data to solve it, and help their staff take quick action based on facts.
For retail leaders wondering where to start: pick one operational problem, find the data you need, connect those systems using agile tools, and measure the sales results honestly.
Understanding the theory of data is easy, but connecting legacy POS hardware, building reliable data pipelines, and setting up practical analytics tools requires specialized technical support. At VTI, we specialize in helping retail enterprises bridge the gap between old technology and modern DX. Whether you need to connect your ERP, CRM, and POS systems into a secure cloud system, or implement data tools to improve store operations, our team provides the technical foundation needed to help your business grow.
If you are looking for practical ways to connect your retail data and improve your operations, feel free to contact the VTI Retail DX team to share your challenges.